
T1ρ magnetic resonance: basic physics principles and applications in knee and intervertebral disc imaging
Principle of T1ρ MR imaging
T1ρ relaxation-theory
In MRI physics, the process of radiofrequency (RF) pulse excited spins returning to their equilibrium status is called relaxation. The magnetization is realigned with the longitudinal direction as the main magnetic field B0. Topographical images with different contrasts can be generated based on different tissue relaxation properties. Spin-lattice and spin-spin relaxations described by relaxation time of T1 and T2 are two most commonly leveraged tissue properties, resulting in T1-weighted and T2-weighted images respectively.
T1ρ (or T1ρ) relaxation time describes spin-lattice relaxation in the rotation frame at the presence of an external RF pulse in the transverse plane. T1ρ relaxation was first described in 1955 (1), but has only been applied in MRI in the late 1980’s providing extra tissue information beyond T1 and T2-weighted images (2,3). In the pure spin-lattice or T2 relaxation, magnetization undergoes relaxation in the transverse plane and decays exponentially, while it experiences a slower relaxation process at the presence of the external RF pulse called spin-lock RF pulse (BSL). Being analogous to the alignment of spins along the main magnetic field of B0 in the laboratory frame, some spins revolve around the direction of BSL in the rotating frame at the frequency determined by the Larmor equation, FSL = γ∙BSL, where γ is the gyromagnetic ratio of hydrogen atom of 42.58 MHz/T and FSL is called spin-lock frequency. Note that in the case of on-resonance excitation, the influence of B0 could be neglected. The impose of BSL to some degree slows the magnetization relaxation process in the transverse plane by forcing the spins process along its direction. Consequently, the relaxation time of T1ρ is longer than the relaxation time of T2 for the same tissue. In addition, T1ρ is positive related to the strength of BSL. It is intuitive that a stronger BSL is able to more efficiently “lock” the transverse spins along its direction, leading to a longer T1ρ relaxation time, and that is similar to the fact that spin-lattice relaxation time T1 increases with the strength of B0.
T1ρ imaging provides a viable approach to study low-frequency motional biological processes such as protein, proton exchange between water and macromolecules which may be not feasible by applying T1 or T2 MR imaging. Spin-lattice relaxation process maximizes at the spins moving at or around the Larmor frequency which is determined by the strength of B0, e.g., about 64 MHz at 1.5T and 128 MHz at 3T, making T1 imaging difficult to directly characterize low-frequency motion atoms and molecular. Fortunately, T1ρ relaxation process maximizes at FSL, which is generally in the low frequency range, i.e., several hundred Hertz, and adjustable by changing the BSL strength. Therefore, the T1ρ imaging can be tailored for studies of biological processes at different frequencies while taking the advantages of high field MRI scanner such as high signal to noise ratio (SNR).
Spin-lock pulse and T1ρ imaging
The procedure of changing the magnetization amplitude based on the tissue T1ρ value refers to T1ρ weighted magnetization preparation. Like many other magnetization preparations including saturation, inversion, magnetization transfer, and chemical exchange saturation transfer, T1ρ-weighted magnetization preparation itself cannot generate MR images. T1ρ-weighted MR images are obtained by the subsequent acquisition sequences.
The T1ρ weighted magnetization preparation pulse is often known as spin-lock pulse which is shown in Figure 1. The first short pulse P1 flips magnetization into the transverse plane along the y-axes in the rotation frame. The substantial spin-lock pulse PSL is applied on the same direction with a duration of TSL and a strength of BSL. The rotation angle ΦY during the PSL is defined by 2π·FSL·TSL, where FSL is calculated by γ·BSL. A final short pulse P2 is applied opposite to P1 afterwards to return the T1ρ-relaxed transverse magnetization to the original longitudinal direction.

For T1ρ weighed imaging, the residual transverse magnetization is destroyed by a strong gradient crusher after the spin-lock pulse, and then a normal acquisition pulse sequence is applied for signal acquisition. Finally, a sufficiently long wait time is applied to recovery the magnetization to its equilibrium state. The block diagram for typical T1ρ weighted imaging process is illustrated in Figure 2. In practice, other imaging module like fat suppression can be embedded into this diagram according to the specific requirements in different applications.

T1ρ weighted contrast, T1ρ mapping and T1ρ dispersion
T1ρ MR imaging is normally utilized in three forms. They are T1ρ weighted contrast imaging, T1ρ mapping and T1ρ dispersion imaging.
T1ρ weighted contrast imaging is the basic form. This is mostly done by applying a spin-locking pulse prior to imaging, allowing adequate time for T1ρ relaxation to occur, and then “storing” this T1ρ prepared magnetization along the longitudinal direction. T1ρ weighted contrast imaging involves only a single spin-lock time at a certain spin-lock frequency to generate an appropriate T1ρ weighted contrast level.
T1ρ mapping is the most common form of T1ρ imaging and has been most intensively used for various applications. T1ρ mapping involves at least two, usually multiple spin-lock times at a certain spin-lock frequency to obtain a series of images with different levels of T1ρ weighted contrast. Voxel-wise image intensities with different TSLs are then fitted to a mono-exponential decay mathematical model, described by Eq. [1], to calculate the voxel-wise T1ρ values, which is called T1ρ map (Figure 3).


Though the scan time of T1ρ mapping is longer than T1ρ weighted contrast imaging due to multiple TSLs were used, T1ρ mapping gives voxel-wise T1ρ values that are independent of acquisition sequence as quantitative biomarkers rather than the qualitative T1ρ-weighted contrast for the better characterization of tissue properties.
T1ρ dispersion is the dependence of T1ρ relaxation time with spin-lock field strength (BSL), or spin-lock frequency (FSL). Therefore, T1ρ dispersion imaging usually involves T1ρ quantification or mapping for at least two spin-lock frequencies. Because T1ρ relaxation is sensitive to the low-frequency motional processes around or at spin-lock frequency, T1ρ dispersion which is also a tissue property provides a representation of the tissue at low frequencies and reflects useful information like protein content, composition of tissue and proton exchange between water and macromolecules. The simplest T1ρ dispersion imaging is performed with two FSLs T1ρ dispersion factor. The ratio of T1ρ value at low and high FSL was assessed for quantification purpose (4,5).
Techniques of T1ρ MR imaging
Design of spin-lock RF pulse
Theoretically, the magnetization along the spin-lock pulse field direction decays mono-exponentially with regard to spin-lock time TSL at the rate of 1/T1ρ. However, in practice, the actual spin-lock pulse field direction and strength could be obscured by the presence of B0 and B1 field inhomogeneities due either to the imperfection of MRI hardware or to the susceptibilities and heterogeneities of the imaged subject. In the presence of B0 and B1 field inhomogeneities, the effective spin-lock field direction and strength may be considerably deviated from the nominal spin-lock direction and strength, leading to the poor alignment of the magnetization along the desired spin-lock direction as well as the complicated magnetization evolution rather than the ideal mono-exponential decay along the nominal spin-lock direction. B1 inhomogeneities lead to the deviation of true spin-lock frequency from the nominal spin-lock frequency. In the presence of B0 inhomogeneities, the magnetization nutates about the effective spin-lock field direction indicated in Figure 4, deviated from Z direction with an angle θ=tan−1(Δω1/Δω0)=tan−1(FSL/γΔB0). The effective spin-lock field strength is calculated as Δωeff = (Δω02 + Δω12)1/2. This poor alignment and the complicated magnetization evolution are finally presented in the form of banding-like artifacts on T1ρ-weighted images and also result in the errors of T1ρ quantification using the traditional mono-exponential decay model. As seen from Figure 4, a simple solution to reduce the influence of B0 inhomogeneity is to use a spin-lock pulse with strong spin-lock field strength and large FSL so that θ approaches 90° and Δωeff ≈ Δω1. However, this is restricted by the scanner hardware performance as well as the regulation of specific absorption rate (SAR) on human scan. B0 shimming and B1 calibration are also helpful but often not sufficient to alleviate the banding artifact. Therefore, the improved design of spin-lock RF pulse is vital to the T1ρ-weighted image quality and the accurate quantification of T1ρ relaxation time.

To precisely trace the magnetization evolution at each time point during a SL pulse, full Bloch analysis is necessary but too complicated. To simplify the analysis while maintain the acceptable accuracy, the transient relaxation effect is usually neglected. As such, the magnetization evolution can be conveniently traced by the multiplication of a series of rotation and relaxation matrices to present each RF component in the cluster of a composite spin-lock pulse. An instantaneous RF pulse is represented in the form of matrix notation Rφ(ϕ), where R denotes a rotation matrix, φ is the pulse field orientation and ϕ is the pulse flip angle. The magnetization evolution under an RF pulse could be generally expressed by Mt1 = Rφ(ϕ)Mt0, where Mt0 and Mt1 denote the magnetization before and after the pulse excitation, respectively. The basic rotation matrices that rotate magnetization about the x, y, or z axis by an angle ϕ, in three dimensions, are expressed respectively as Eq. [2]:
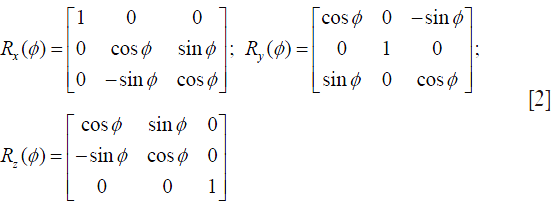
Note that each of these basic magnetization vectors rotates clockwise about the axis, and the coordinate system is right-handed. The spin-lock relaxation matrix under a spin-lock pulse with duration T is given by Eq. [3], assuming spin-lock pulse is along y direction:
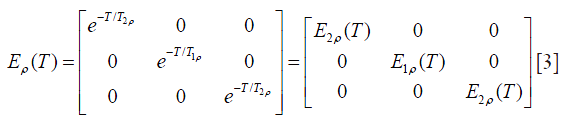
Note that T2ρ is the decay rate of the magnetization perpendicular to the spin lock pulse.
Normal spin-lock pulse
Assuming the flip angle of β for the tip-down pulse P1 and the tip-up pulse P2, and α for the spin-lock component SL, α=2π∙FSL∙TSL for a given spin-lock frequency FSL, the magnetization evolution is expressed in Eq. [4]:
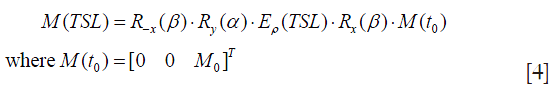
Since P1 and P2 usually have much shorter duration than SL, the relaxation during P1 and P2 is negligible. By substituting Eq. [2] and Eq. [3] into Eq. [4], It is easily derived the final longitudinal magnetization Mz as given by (6).

According to Eq. [5], Mz follows an exponential decay as long as β equals to π/2 or 90°. In the presence of B1 inhomogeneites and β no longer equals to π/2, Mz shows a composite function to many factors of T1ρ, T2ρ and α, reflected in the image as banding artifact. Because α is dependent on both TSL and FSL, the location distribution of artifacts varies with TSL and FSL as well.
Rotary echo spin-lock pulse
To compensate for artifacts caused by B1 inhomogeneity, a rotary echo spin-lock pulse (Figure 5A) was proposed (6). This rotary echo SL pulse is divided into two segments (SL1 and SL2 in Figure 5A) with the equal duration but the opposed phase, and effectively eliminates the rotation spin-lock phase accumulation.

The magnetization evolution under the application of a rotary echo spin-lock pulse can be expressed by Eq. [6]:
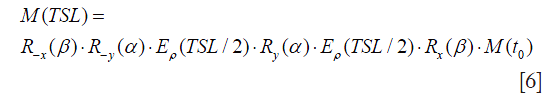
Note that here α=2π∙FSL∙(TSL/2). The final longitudinal magnetization Mz is derived as:

Comparing Eq. [5] and Eq. [7], the term of cosα has been completely eliminated in Eq. [7] so Mz no longer shows TSL- or FSL-dependent artifact distribution. However, it is worth pointing out that rotary echo pulse could still show some artifacts when β does not equals to π/2. Meanwhile, Mz does not show pure T1ρ-weighted contrast and may contaminated by T2rho-weighted contrast in the presence of B1 inhomogeneity.
In the presence of B0 inhomogeneities, the magnetization evolution could also be traced quantitatively by Eq. [8] (7):
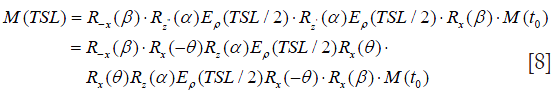
where θ is the direction of the effective spin-lock field as shown in Figure 4. The final longitudinal magnetization Mz is given by:
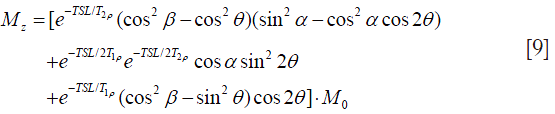
Eq. [9] shows that the resultant longitudinal magnetization by a rotary echo SL pulse in the presence of B0 inhomogeneity does not show a pure T1ρ contrast, but a very complicated composite contrast dependent on many factors, including T1ρ, T2rho, B0 inhomogeneity, TSL and FSL. Although complicated, Eq. [9] provides a possible means to simultaneously quantify T1ρ, T2rho and B0 inhomogeneity even in the presence of banding-artifacts, particularly at low spin-lock frequencies (7).
B1 and B0 insensitive composite spin-lock pulse
Rotary echo pulse is still susceptible to B0 inhomogeneity. Witschey et al. (8) proposed new B1 and B0 insensitive composite spin-lock pulses to further reduce the sensitivity of rotary echo spin-lock pulses to B0 inhomogeneities by inserting an 180° refocusing pulse between the two rotary-echo spin-lock pulse segments of SL1 and SL2 (Figure 5B). This 180° refocusing pulse works just similar to the refocusing pulse used in the normal spin-echo acquisition pulse sequences. The spins nutating about the effective spin-lock field direction at the first spin-echo pulse section SL1 is reversed and then return back to the original position after processing about the effective spin-lock field direction at the second spin-lock section. The analytical expression of the magnetization under this B1 and B0 insensitive composite spin-lock pulse could be derived as:
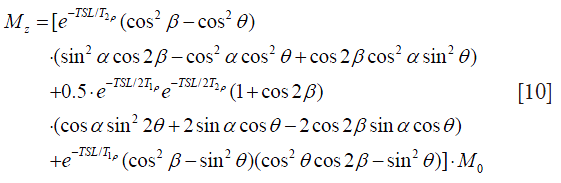
The detail derivation is neglected here. In Eq. [10], the flip angle of the refocusing pulse is written as 2β. If β=90°, Eq. [10] is simplified exactly as Eq. [7].
Another revision of this B1 and B0 insensitive composite spin-lock pulse is to change the direction of the tip-up pulse P2 from −x to x (8) (Figure 6). The purpose of this alternation is to compensate for the imperfect flip angle β and make it more robust to B1 inhomogeneity.

Dixon’s composite spin-lock pulse and phase cycling
In 1996, Dixon et al. proposed a composite spin-lock pulse in the form of 90(y)−135(x)−360(x,SL)−135(x)−90(−y) for myocardial suppression. This composite pulse is tolerant to shimming and frequency errors for the cases of small off-resonance. Meanwhile, the strength and duration of each section in this composite pulse are required to meet some particular quantitative relationship. Actually, the magnetization evolution under Dixon’s composite spin-lock pulse could also be calculated through the approach of multiplication of a series of rotation and relaxation matrices as used above. The result suggests that the effectiveness and robustness may be restricted in practice if the B0 or B1 inhomogeneity is relatively large and the strength and duration requirement for each pulse elements are not well fulfilled.
The idea of phase cycling has also been proposed to reduce the spin-lock artifacts by using two T1ρ-weighted images. The first T1ρ-weighted image is acquired using a normal spin-lock pulse and the second image is acquired using the same spin-lock pulse but with the flip angle of P2 inversed. The final image is the subtraction of the acquired two images (10). Using the theoretical analysis approach above, it can be shown that the longitudinal magnetization after this process is:

As seen from Eq. [11], phase cycling is robust to B1 inhomogeneities. Even the tip pulse flip angle β is not exactly 90°, the resulting magnetization still follows the mono-exponential decay and suffers no contamination from T2ρ relaxation and the spin-lock flip angle α relating to FSL and TSL. On the other hand, the disadvantage of phase cycling is also obvious. The acquisition of two images doubles the scan time.
Recently, Chen et al. (11) combined the Dixon’s composite spin-lock pulse and phase cycling together, named phase-cycled composition spin-lock (PCC-SL), for B0 and B1 field inhomogeneity compensation, and compared the performance of PCC-SL with individual Dixon’s approach, phase cycling and other composite spin-lock pulses. The results showed that PCC-SL outperformed to other approaches in artifact reduction and T1ρ quantification.
In summary, many approaches have been proposed to design composite spin-lock pulses for T1ρ imaging to reduce spin-lock artifact and hence more accurate T1ρ quantification. Although significantly improvement compared to the traditional spin-lock pulse, the availability of these composite spin-lock pulses on clinical scanners is still limited. Meanwhile, effectiveness and robustness of these composite spin-lock pulses may still be compromised in practice and have to be further validated, in particular for the cases of long spin-lock duration, low spin-lock frequency and pronounced susceptibilities.
Pulse sequences used for T1ρ imaging data acquisition
The pulse sequences used for quantitative T1ρ imaging usually consist of T1ρ preparation followed with data acquisition. There are a number of imaging sequences which can be used to collect data after T1ρ contrast is imparted into the magnetization. The signal evolution during imaging sequence may complicate the quantification of T1ρ and therefore care is needed in pulse sequence design for quantitative T1ρ imaging.
Borthakur et al. (12) reported a 3D imaging method based on steady state spoiled gradient echo acquisition. The signal at steady state in this method can be expressed by the following equation:
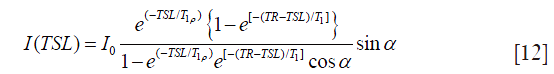
where α is the flip angle, and TR is the repetition time. Note Eq. [12] deviates from conventional mono-exponential model used for T1ρ quantification and the knowledge of T1 is needed in the model. The presence of flip angle in Eq. [12] indicates the sensitivity of this method to B1 inhomogeneity.
Li et al. (13) reported a 3D quantitative T1ρ imaging method termed MAPSS which is based on segmented SPGR acquisition. The data is acquired during the transient signal evolution toward steady state. If the magnetization after T1ρ preparation is Mprep, with Bloch equations, it can be shown that for segmented SPGR acquisition the transverse magnetization after the nth RF pulse is (13):

The expression of A(n) and B(n), which are complicated functions of relaxation parameters and pulse sequence parameters, can be found in reference (13). Note the term B(n) in Eq. [13] is an additive term which causes the model deviate from mono-exponential decay. Li et al. (13) proposed to acquire two data sets with phase cycling of the tip-up RF pulse at the end of T1rho preparation, and form the final images by subtracting them from each other to remove B(n) term. This method makes it feasible to use simple mono-exponential decay to quantify T1ρ value, however, at the cost of doubled scan time.
The magnetization after T1ρ preparation can also be acquired with conventional multi-slice 2D imaging methods. T1 relaxation during imaging data acquisition can cause signal to deviate from mono-exponential model. The same phase cycling method has been reported to address this issue in multi-slice quantitative T1ρ imaging (10).
Fast (or Turbo) Spin Echo (FSE or TSE) has also been reported for T1ρ imaging (14,15). In FSE acquisition, when the CPMG condition is met and the crusher gradient is sufficient so that FID is eliminated, T1 recovery during the readout does not confound the relaxation profile imparted in magnetization from T1ρ preparation. The point spread functions are identical for data acquired at different TSLs. Therefore, the relative image intensity at different TSLs depends only on T1ρ exponential decay during T1rho prep, and no phase cycling is needed in order to use mono-exponential relaxation model, which makes FSE based T1ρ imaging highly SNR efficient. The downsides of 3D T1ρ imaging with FSE acquisition include the requirement of CPMG condition, increased echo time, and potential blurring from long echo train (14).
Balanced gradient echo (16) has also been reported for T1ρ imaging. Instead of acquiring imaging data in steady state, signal needs to be acquired during transient stage. Otherwise, contrast loss during the transient decay can result in elevated T1ρ estimation (16).
Towards fast T1ρ imaging at high field with low SAR
To apply T1ρ imaging for clinical applications, RF energy deposition by the spin-lock pulses has to be concerned and the associating SAR has to meet the requirement of relevant safety regulations. SAR is normally defined as the amount of RF energy per unit mass per unit time deposited into the imaged subject during an imaging experiment. For example, the U.S. Food and Drug Administration (FDA) has established guidelines to regulate the allowable maximum SAR for clinical imaging, i.e., 4 W/kg averaged over the whole body for any 15-minute period, 3 W/kg averaged over the head for any 10-minute period; or 8 W/kg in any gram of tissue in the extremities for any period of 5 minutes.
According to the SAR model proposed by Collins et al. in 1998 (17), SAR is proportional to the square of the RF pulse flip angle and the square of static field strength B0. In general, T1ρ imaging is SAR intensive due to the long spin-lock time and hence large flip angle. Furthermore, spin-lock pulses with strong field strength and spin-lock frequency are often preferable for the purpose of artifact reduction, which makes the SAR problem more prominent in practice, particularly for high field MRI scanners. In order to maintain the SAR within the allowable limits, acquisition TR for T1ρ imaging is often significantly lengthened, resulting in a proportional increase of the total scan time and hence the reduction of patient comfort as well as the increased proneness to motion artifact.
The most straightforward and convenient method for the reduction of SAR is to reduce the spin-lock field strength or spin-lock frequency. Unfortunately, the fact is that this method is rarely used because the low spin-lock frequency also brings the severe problem of spin-lock artifact in the presence of B0 and B1 homogeneities and hinders the accurate quantification of T1ρ. In this aspect, the use of various dedicated composite spin-lock pulse to reduce spin-lock artifact is beneficial for SAR reduction. Another approach is to quantify T1ρ using the model different from the mono-exponential one even in the presence of artifact, if the magnetization evolution and its relationship with imaging parameters could be analytically derived (7). This approach does not require the complicated design of composite spin-lock pulses but the analytical T1ρ model has to be derived individually for each kind of spin-lock pulse. Sensitivity, accuracy and precision of T1ρ fitting according to these complicated models with regard to imaging parameters have to be concerned and investigated carefully to justify the fitting results.
For T1ρ mapping studies in which multiple TSLs are usually applied, the reduction of the TSL number, is also an effective means to reduce the total spin-lock RF energy deposition and the total scan time, although the averaged SAR does not reduce. Theoretically, two TSLs are sufficient to calculate T1ρ based on the mono-exponential model because T1ρ is the only unknown parameter to be fitted. However, the calculated T1ρ may be susceptible to noise and the accuracy of T1ρ calculation is much dependent on the TSL applied, true T1ρ value and signal-to-noise ratio. Yuan et al. (18) studied the accuracy of T1ρ mapping by using two TSLs through theoretical analysis and Monte Carlo simulation. Segmented T1ρ acquisition could also be applied to reduce SAR for each TSL. In this approach, spin-lock pulse is not applied for each k-space line acquisition. Instead, every spin-lock pulse for T1ρ preparation is followed by acquisitions of multiple k-space lines. The extreme case of segmented T1ρ acquisition is the single-shot T1ρ acquisition in which all k-space lines are acquired after the only one T1ρ preparation.
Spin-lock RF pulse is an important source of RF energy deposition but not the only one because it has to be combined with normal acquisition pulse sequences. Therefore, other general approaches to reduce SAR could also be employed. For example, the use of partial Fourier acquisition and parallel imaging (19-21) is helpful to reduce the phase-encoding numbers and hence the number of spin-lock pulses applied. Compressed sensing reconstruction (22,23) is also beneficial and some preliminary results have been presented (24). It is well known that MR image contrast is majorly determined by the central k-space lines while the peripheral k-space lines determine the fine edge detail. Wheaton et al. (25) proposed a partial k-space acquisition approach in which a full power spin-lock pulse is applied to only the central phase-encode lines of k-space, while the remainder of k-space receives a low-power spin-lock pulse. SAR was reduced by 40% while the error of T1ρ mapping was only 2%, as demonstrated on human brain T1ρ imaging at 1.5T. For some specific applications in which only a fraction of the whole image may be interested, such as spine and cartilage T1ρ imaging, reduced field-of-view (rFOV) method (26,27) could be applied to reduce the phasing encoding numbers and hence SAR and total scan time. For the application of T1ρ imaging at ultra-high field strength B0 higher than 3T, the design of spin-lock pulse based on parallel excitation (28) should be promising to reduce SAR.
Applications of T1ρ MR imaging
Applications of T1ρ MR imaging in articular cartilage
During the recent years, T1ρ-weighted contrast, T1ρ relaxation time mapping, and T1ρ dispersion have been extensively studied, covering various organs and a wide range of disease processes, including brain (29-38), heart (39,40), liver (41-45), muscle (46,47) cancer (4,48), and joint cartilage (39), intervertebral discs (49). T1ρ MR imaging is a relative time consuming technique, imaging of joint and intervertebral disc usually benefit from is very limited physiological motion. This review primarily covers T1ρ imaging’s application in articular cartilage. For other musculoskeletal components, another recent review has wider coverage (50).
Osteoarthritis (OA) is a multifactorial disease characterized primarily by the progressive loss of articular cartilage. OA constitutes a significant health burden affecting more than 27 million people in US alone (51,52), and has been recognized as one of the fastest growing medical conditions worldwide due to the increased prevalence of obesity and aging of society (53). The disease is characterized primarily by articular cartilage degeneration, however, cartilage loss and OA symptoms are preceded significantly by damage to the collagen-proteoglycan (PG) matrix and elevation of cartilage water content (54) (Figure 7).

Due to aging populations and increasing rates of obesity in the developed world, the prevalence of OA is continually increasing. Decreasing the societal and patient burden of this disease motivates research in prevention, early detection of OA, and novel treatment strategies against OA. One key facet of this effort is the need to track the degradation of tissues within joints, especially cartilage. Currently, conventional imaging techniques provide accurate means to detect morphological deterioration of cartilage in the later stages of OA, but these methods are not sensitive to the subtle biochemical changes during early disease stages. During the past decade, MR techniques that quantify cartilage matrix changes have developed rapidly, with the rationale that detecting early and subtle cartilage degeneration is critical for allowing early intervention, monitoring treatments, and allowing prevention strategies for OA (55-58). Among these techniques, T1ρ has gained significant attention which needs no contrast agent and detects early changes in cartilage matrix with a high sensitivity to loss of PG.
In vitro studies have evaluated the relationship between T1ρ and the biochemical composition of cartilage. Early studies using bovine cartilage demonstrated a strong correlation between changes in PG and T1ρ (59), and proposed T1ρ as a more specific indicator of PG content than T2 relaxation in trypsinized cartilage (60). In T1ρ imaging experiments, the spin-lock techniques reduce dipolar interactions and therefore reduce the dependence of the relaxation time constant on collagen fiber orientation n cartilage (61). This enables more sensitive and specific detection of changes in PG content using T1ρ as compared to T2, although T1ρ changes in cartilage may be affected by hydration and collagen structure as well. The reduced dipolar interaction also results in less ‘magic angle effect’ in T1ρ imaging as compared to T2 imaging. Less laminar appearance was observed in T1ρ-weighted images compared to T2-weighted images (61). Previous specimen studies reported that T1ρ values at the magic angle (54.7°) were significantly higher than at other angles, but the difference was smaller than the different in T2 values at the same angles (62). The different was decreased with increased T1ρ spin-lock frequencies and was diminished when T1ρ spin-lock frequency was equal to or higher than 2K Hz (61). In OA cartilage obtained from patients who underwent total knee arthroplasty, it was demonstrated that T1ρ values were correlated with clinical and histological grades of degeneration and with GAG contents (62,63). In addition to GAG concentration, T1ρ has also been reported to correlate with biomechanical properties of cartilage. T1ρ relaxation rate was strongly correlated with aggregate modulus and hydraulic permeability in bovine cartilage (64). Using indentation techniques, significant site-specific correlation was observed between T1ρ and the phase angle, a viscoelastic mechanical behavior of the cartilage measured by indentation, in human OA tibial specimens (65). Recent studies showed that the adiabatic and continuous wave T1ρ were strongly correlated with OARSI grade and biomechanical parameters (66), and T1ρ/T2 were correlated with cartilage initial elastic modulus at both 500 Hz and 1,000 Hz (67). These studies form the experimental basis for using the T1ρ mapping techniques in studying cartilage pathology in OA.
The mechanism of T1ρ relaxation time in biological tissues, particularly in cartilage, is not fully understood yet. Using native and immobilized protein solution, Makela et al. suggested that proton exchange between the protein side chain groups and bulk water contribute significantly to the T1ρ relaxation (68). Based on spectroscopy experiments with peptide solutions, GAG solutions and bovine cartilage samples before and after PG degradation, Duvvuri et al. further suggested that in cartilage hydrogen exchange from NH and OH groups to water may dominate the low frequency (0−1.5 KHz) water T1ρ dispersion (69). They speculated that increase of the low frequency correlation rate with PG loss could be the result of increased proton exchange rates. Other evidence of a proton exchange pathway is the PH dependency of T1ρ values in the ischemic rat brain tissues (70). Mlynárik et al. on the other hand, have suggested that the dominant relaxation mechanism in the rotating frame in cartilage at B0 ≤3T seems to be dipolar interaction (71). The contribution of scalar relaxation caused by proton exchange is only relevant at high fields such as 7T. Clearly, further investigations are needed to better understand this relaxation mechanism.
In vivo T1ρ reproducibility from single site studies was reported excellent with CVs ranging from 1.7−8.7% (10,13,72). Results from multicenter studies however vary, with one study reported CV ranging 7−19% (73), while one more recent study ranging 2−6% (74). Future studies are warranted to evaluate multi-site multi-vendor variation of T1ρ quantification with a clinical trial setup. T1ρ values were shown to increase with ages (75) and were significantly higher in women than men in patellofemoral and lateral tibial-femur compartments in a middle-aged OA cohort (18 men, 25 women) (76). In vivo studies show increased cartilage T1ρ values in OA subjects compared to controls (10,15,75,77-80). T1ρ and T2 values in asymptomatic active healthy subjects with focal cartilage abnormalities were found to be significantly higher than those without focal lesions (75), suggesting that T1ρ and T2 could be parameters suited to identify active healthy subjects at higher risk for developing cartilage pathology. In patients (n=20) with patellar-femoral pain (PFP) but no evidence of OA, significant elevated T1ρ were found in the lateral facet of patella cartilage, but no medial facet, compared to controls, and the T1ρ values of PFP patients were significantly correlated with the degree of patellar tilt (81). No significant differences were noted in T2 relaxation times. Further, elevated T1ρ was observed in subcompartments in OA subjects where no obvious morphologic changes were observed, suggesting the capability of T1ρ in detecting very early biochemical changes within the cartilage matrix (78). T1ρ measurements were reported to be superior to T2 in differentiating OA patients from healthy subjects, especially at early stages (75,78,82), potentially due to the higher sensitivity of detecting PG changes in the matrix. Elevated T1ρ has been correlated with lesions identified with arthroscopy, and showed increased sensitivity and specificity of detecting cartilage damage compared to morphologic images (83-86) (Figure 8). T1ρ imaging has also been applied to evaluate cartilage repair tissue after following microfracture (MFx) and mosaicplasty (MOS) cartilage resurfacing procedures, and showed preliminary results that a differentiation between different tissue types after cartilage repair procedures was possible by applying T1ρ mapping, in particular, in combination with T2 mapping (87-89).

In addition to the average values, the heterogeneity of T1ρ values was evaluated using gray-level co-occurrence matrices (GLCM) (90-93). Significant increased heterogeneity of cartilage T1ρ and T2 were observed in subjects with OA compared to controls, and such texture analysis showed improved group discrimination as compared to the global average (91). The pixel-by-pixel correlation between T1ρ and T2 showed a large range in both controls and OA patients (R2 ranging from 0.221 to 0.763 in OA patients vs. R2 ranging from 0.547 to 0.726 in controls (92). These results suggested T1ρ and T2 may have different spatial distribution and provide complementary information regarding cartilage degeneration in OA (Figure 9). Combining these two parameters may improve our capability for diagnosis and staging the disease.

The relationship between cartilage degeneration and lesions of other tissues in the joint were studied using T1ρ imaging. T1ρ values of medial femoro-tibial cartilage were significantly higher in subjects having meniscal tears compared to subjects without a meniscal tear (94-96). These studies provided quantitative evidence linking meniscal injury to OA development. T1ρ values were reported to be higher in regions overlying bone marrow edema-like lesions (BMEL) in subjects with OA and acute anterior cruciate ligament (ACL) injury (97). OA patients with BMEL showed overall higher T1ρ values in cartilage compared with those who had no BMEL, suggesting BMEL may be correlated with disease severity of OA (98). Furthermore, cartilage overlying BMEL showed a significantly higher T1ρ value increase from baseline to 1-year follow up compared to surrounding cartilage, suggesting BMEL is indicative of accelerated cartilage degeneration. Interestingly, no such difference was found using WORMS scoring. This result suggests that quantitative cartilage imaging, such as T1ρ, may be a more sensitive indicator of cartilage degeneration than semi-quantitative scoring systems.
Previous clinical studies suggest that acute ACL injury is a risk factor for post-traumatic OA development and T1ρ imaging have been applied for assessment of early cartilage damage and degeneration after ACL injury (85,97,99-103). Significant elevated cartilage T1ρ values were observed after acute ACL injury (normally less than 6-month of injury and before ACL reconstruction) (97,99). The most significant T1ρ elevation was normally observed in posterior lateral tibia overlying BMELs, indicating the damage to cartilage during the initial injury. T1ρ values in posterior lateral tibial were correlated with the volume of BMEL (97), suggesting that T1ρ values in these regions may be a potential indicator of injury severity during ACL tear. After ACL reconstruction, cartilage T1ρ values in posterior lateral tibia decreased compared to baseline but were still significantly higher than controls, suggesting potential irreversible damage of cartilage in these regions despite the resolution of BMEL (Figure 10). In the medial side, T1ρ values were significantly higher than controls as early as 1-year after ACL reconstruction, and keep increasing over 2-year after ACL reconstruction (100,101,103). Using loaded MRI, it was recently demonstrated that the abnormal knee kinematics including anterior tibia translation and internal rotation, is correlated with T1ρ in the medial side of the ACL-reconstructed knees (104,105). Increased T1ρ values in the medial side of ACL-reconstructed knees were also correlated to higher peak knee adduction moments (KAM) measured with 3D motion analysis (106). These results provide quantitative direct evidence of linking abnormal biomechanics to the joint degeneration after ACL reconstruction. Quantitative T1ρ can probe these degenerations at much earlier time points than radiographs or conventional MRI.

Loading plays a critical role in the development of healthy cartilage, as well as in the progression of OA. Both excessive load and inadequate load have been shown to result in degenerative changes in articular cartilage (107-109). T1ρ imaging provides a powerful in vivo tool to study cartilage responses to loading quantitatively. MRI T1ρ and T2 were applied to evaluate cartilage changes in asymptomatic marathon runners (110,111). Significantly higher T2 and T1ρ values were observed within 48 hours after running, although runners did not demonstrate any gross morphologic MRI changes after running a marathon (110). More interestingly, after 3 months the T2 values recovered to baseline in all compartments except for the medial femoral condyle, while T1ρ values remained elevated at the 3-month follow-up MRI (110). These results suggest that while T2 may be more subjected to transient fluid shifts (in the articular cartilage and meniscus) as responses to loading, T1ρ may be an indicator of early loss of PG in cartilage matrix.
Significant differences in T1ρ was found in asymptomatic female collegiate athletes between impact subjects (ten basketball players) and nonimpact subjects (ten swimmers), suggesting different loading to the joint will affect the cartilage composition which is detected by T1ρ imaging (112). In 26 subjects with a clinical diagnosis of KL1-3 OA, T1ρ was found to be significantly higher in medial tibial central cartilage than lateral tibial central cartilage in varus group, suggesting association between knee alignment, therefore different loading to different compartments, and T1ρ values of femorotibial cartilage in patients with clinical OA (113).
Using a MR-compatible loading device, significant decreases of T1ρ and T2 were observed with simulated static loading (50% body weight) (114-116). The decreases of relaxation times were probably due to loss of water content and alteration to the matrix structure under acute loading. In 137 subjects with and without knee OA, reductions of T1ρ and T2 were larger for subjects with OA (range, 13−19% change) when compared to healthy controls (range, 3−13% change) (116), suggesting loaded T1ρ and T2 values can be a sensitive marker for the impaired biomechanical properties of OA cartilage.
In summary, T1ρ imaging in cartilage can provide valuable information related with biochemical changes in cartilage matrix. In particular, compared to more established T2 relaxation time, T1ρ provides more sensitive detection of PG loss at early stages of cartilage degeneration. Similar as T2 quantification, T1ρ quantification requires no contrast agent inject and no special hardware, therefore has the great promise to be used in multicenter clinical trails and be translated into clinical practice. Technique challenges of T1ρ quantification include high energy deposited to tissue (high SAR) and relatively long acquisition time. Advanced acceleration techniques have shown great promise to reduce the acquisition time without sacrifice quantification accuracy (117-119). Advanced image processing tools including robust cartilage segmentation are also critical for accurate T1ρ quantification. Recent efforts include automatic atlas-based cartilage segmentation and voxel-based relaxometry (VBR) analysis (120,121). In addition to the knee joint, T1ρ imaging has been applied to other joints such as hip (Figure 11) (122-126).

Applications of T1ρ MR imaging in intervertebral disc
Musculoskeletal conditions are the most common cause of severe long term pain and physical disability, and they affect hundreds of millions of people around the world. Currently, the global population is experiencing a shift in its age structure due to decreasing fertility rates and increasing longevity. As a result, clinicians worldwide will be required to manage an increasing number of spinal disorders specific to the elderly and the aging of the spine. Spine degeneration and associated clinical symptomatology is a major socioeconomic burden (127-129). Degenerative disc disease of the intervertebral disc is the most common cause of back pain associated disability in adults across the world. Early signs of disc degeneration are manifested by biochemical changes, including a loss of PGs, a loss of osmotic pressure and hydration. In the later stages of disc degeneration, morphological changes occur, including a loss of disc height, disc herniation, annular tears and radial bulging. Disc degeneration can be a combination of a physical aging process and as well as pathological process. In an analysis of published data of 600 autopsy specimens of young and middle-aged subjects younger than 50 years, intervertebral disc degeneration was observed in men in the 2nd decade of life, occurring at an earlier age than in women; the severity of aged matched disk degeneration was also being generally greater in men (130). In a later independent histologic study, Łebkowski et al. (131) investigated 308 lumbar intervertebral disks at autopsy from 57 women (mean age, 41.8 years) and 79 men (mean age, 42.1 years). Disk degeneration became first readily apparent during the 2nd decade of life, though it was observed to occur in men almost a decade earlier than in women. However, after menopause women show accelerated lumbar disc degeneration compared with men (132,133).
To explore more sensitive imaging biomarkers for disc degeneration, Johannessen et al. firstly published T1ρ imaging of disc ex vivo in 2006 (134). Shortly later Blumenkrantz et al. published in vivo feasibility results (135). T1ρ imaging allows for spatial measurements on a continuous rather than an integer-based grading, minimizes the potential for observer bias. Although there still exist other technical challenges for T1ρ imaging such as high SAR (especially at ultrahigh magnetic field strength) and relatively long acquisition time, T1ρ imaging has the advantages of no contrast agent administration, no RF hardware modification, and the ability to be implemented on any standard clinical scanners. In one recent study of lumbar MRI at 3T (49), It was found for nucleus pulposus (NP), T1ρ and T2 decreases quadratically with disc degeneration grades and have no significant trend difference (Figure 12). For annulus fibrosis (AF), T1ρ decreases linearly as the disc degenerated and has a slope of −3.02 and −4.56 for eight- and five-level gradings respectively; while the slopes for T2 values are −1.43 and −1.84 respectively, being significantly flatter than those of T1ρ (P<0.001, Figure 2). Therefore T1ρ is a more sensitive biomarker for early disc AF degeneration. It is also noted in this study that, for both NP and AF, discs of grade 5/8 to 8/8 degenerations had similar T1ρ and T2 relaxation times without significant statistical difference. This means when the disc degenerated to a certain extent, T1ρ and T2 relaxation time will become insensitive. Therefore, for severe degeneration and disc space narrowing, the 5- or 8-level grading system will remain to be used (136,137). In one study involving 52 subject and at 3T, it was shown an age related reduction of T1ρ and T2 magnetic resonance relaxation times both in the NP and the annulus fibrosus of lumbar intervertebral disc. However, the relative performances of T1ρvs. T2 were broadly similar. Actually, T2 slightly out-performed T1ρ in NP region, but T1ρ slightly out-performed T2 in annulus fibrosus region (Figure 13) (138). In one recent study, T1ρ value was shown to be significantly lower in asymptomatic young male weightlifters compared with a sedentary control group matched for age and sex (139).


Chronic low back pain is a physical symptom with multiple possible causes; defining the specific source of the pain remains a challenge. In degenerated discs, two mechanisms of pain have been proposed, i.e., the ‘‘chemically sensitized’’ and ‘‘mechanically sensitized’’ disc. In the former, degenerating discs can undergo an inflammatory process that involves cytokines, such as interleukins and TNFa as well as specific nociceptive mediators such as prostaglandins and NO. In the latter, degenerated discs are no longer intact. Endplate and annular fissures develop that may bring neovascularity and new nerve growth with unmyelinated nerve endings having nociceptive morphologies and neurotransmitters. With compromised mechanical integrity, the transport of nociceptive mediators to its innervated periphery and adjacent structures in degenerated discs would be easier than in healthy discs, where the transport of solutes, especially larger solutes, is limited. Thus, the physician’s inability to identify a patient’s underlying pathology hinders his choice of treatment. However, MRI does not always show sufficient specificity to identify a degenerated disc as the actual source of the pain. The only tool currently available for direct evaluation of disc pain is provocative discography. Due to its invasive nature, there is no agreement on whether it may still be considered a gold standard or even a reliable procedure. A reliable diagnostic tool that could help a clinician to determine if a disc is the source of the pain in patients with chronic lower back pain is still not available (140). MRI findings of disc protrusion, nerve root displacement or compression, disc degeneration, and high intensity zone are all associated with lower back pain, but individually, none of these abnormalities provides a strong indication that lower back pain is attributable to underlying pathology. This limits their value in refining epidemiological case definitions for low back pain (141). Additionally, It has been suggested that researchers should not focus on extending their capacity to find ‘‘mildly degenerated’’, asymptomatic discs for possible early intervention.
Recently Ogon et al. (142) reported that disc’s T2 relaxation time tended to be lower in the chronic low back pain group than in the control group, and these values were significantly different within the posterior AF. The results indicated a correlation between posterior annulus fibrosus degeneration and chronic low back pain. Ogon et al. proposed that chronic low back pain did not show correlations with T2 values in the anterior annulus fibrosus or NP, but did in the posterior annulus fibrosus, because of low sensitivity against noxious stimuli in the front part of the disc. We expect further studies with T1ρ based technique may be valuable as T1ρ is known to be more sensitive for annulus fibrosus than T2.
Therefore, the clinical value and relevance of imaging biomarkers for early cartilage change remain to be further explored (143). The influencing factors for calculating T1ρ value include individual subject variation, regions of interest (ROIs) measured, water content, spin-lock power, pulse sequence parameters, and protocol settings, etc. Despite the promising results in evaluating small chorts, the value of individual T1ρ measurement in a clinical setting requires validation with reference standard, and larger prospective multicenter trials. Salzmann et al. evaluate clinical outcomes and the quality of repair tissue after autologous chondrocyte implantation using qualitative MR T2-weighted relaxation times. It was found there was only weak correlation of quantitative imaging data and clinical function (144). A critical lack of conclusive evidence still remains to determine whether MRI is reliable in predicting clinical outcomes after cartilage repair and, furthermore, which parameters are most important in determining these outcomes (145,146).
Currently, what is the most efficient approach to obtain T1ρ imaging of the spine remains to be established. Till now most the published paper obtained only single sagittal plane as T1ρ imaging is a time consuming technique. Development for speeding-up data acquisition as well as overcoming B0/B1 inhomogeneity is continuing. Imperfect flip angle of tip-down/tip-up/refocus pulse due to inhomogeneous B1 field will complicate the orientation of the net magnetization. The deviation of the effective spin-lock field from the nominal spin-lock field due to inhomogeneous B0 further complicates the magnetization evolution and leads to signal null (banding artifact) and/or signal contamination from T2ρ relaxation. Improvement of T1ρ quantification can be realized either by reducing artifacts from T1ρ-weighted images and then following the mono-exponential relaxation model for fitting (9), or by fitting the signal intensity of T1ρ-weighted images even with artifacts to a more complicated magnetization model which is able to quantify T1ρ and T2ρ relaxation even in the presence of field imperfections, as demonstrated in the literature (147). The former one works at an image acquisition stage; the latter one works at an image post-processing stage. Wang et al. and Yuan et al. suggested the feasibility of limited number spin-lock time (=3) (148). Zhu et al. proposed PANDA-T1ρ approach to reconstruct the T1ρ-weighted images from under-sampled k-space data and accelerate the acquisition of T1ρ imaging by a factor of 2−4 (117). Johnson et al. proposed precision-guided sampling schedules for efficient T1ρ mapping (149). The optimal signal of spine tissue already remains to be further tested (150). For example, Yuan et al. showed bi-exponential T(1ρ) relaxation was observed in muscles with a longer relaxation component of ~37− ~41 ms (a fraction of ~80− ~88%) and a shorter T(1ρ) relaxation component of ~9− ~11 ms (~12−20%) (151).
Currently there are a number of issues for translational research of novel MR techniques for intervertebral disc evaluation:
- To evaluate one novel MR technique (a new biomarker) against another existing imperfect biomarker, such as the 5-level disc degeneration grading system is not a perfect approach, instead focus should be on evaluating a MR technique against clinical outcomes (152,153). The clinical relevance of disc degeneration grading, i.e. the disc degeneration grading seen on T2 weighted MRI, remain unknown; instead only disc space narrowing is known to be likely related to lower back pain (154). One study by Blumenkrantz et al. (155) that included 16 patients, found a significant correlation between T1ρ data and clinical symptoms. The relevance of these findings is limited by the small size of the group tested;
- 5-level (and 8 level) disc degeneration grading system are mainly based on T2 relaxivity, therefore particularly evaluate T2/T2* measurement against disc degeneration grading are not very meaningful. There are a number of quantitative measures for AF and NP, such as the signal ratio of disc components vs. cerebral spinal fluid (CSF), T2/T2*, T1ρ, CEST (156). The clear advantage of T1ρ as compared with other measurement needs to be explored and validated, particularly considering T2 weight anatomical image offer superior spatial resolution and signal-to-noise ratio. The measurement reproducibility for T1ρ remains to be better established, as well as the influence of susceptibility effect on measurement precision in the targeted regions;
- The best segmentation method for anterior AF, NP, and posterior NP remains to be further explored (157). Actually based on T2 weighted image, it is very difficult to accurately and comprehensively segment these three components (158). This will be especially problematic in severely degenerated discs. To authors’ knowledge, data till now showed T1ρ map and CEST could not separate inner AF and NP either. One recent study seemed to show posterior AF degeneration is related to chronic low back pain, but not anterior AF, NP (142), therefore evaluation of posterior AF may be more important. Disc T1ρ imaging in axial plane may provide more information than sagittal plane. Ex vivo study of T1ρ imaging in axial plane has been reported by Mulligan et al. (159);
- Till now, most studies are cross-sectional, and small in subject number. Few longitudinal studies are available. High quality studies involve clinical endpoints and longitudinal follow-ups will be valuable. Regarding whether the novel MR technique can positively influence clinical management, there are many further questions: (I) can the disc changes detected by novel MR technique amenable to some medical or surgical interventions; (II) what MRI detected disc changes are physiological aging? (III) will some disc changes detected by highly sensitive novel MR technique leading to over-treatment, as they may recover or repair by the physiological mechanism. Some lesions can be learnt from the cancer screen studies. More than two decades of cancer screen for breast cancer and prostate cancer showed that high sensitivity based method leads to many false positive results and over treatment (160-163). Early detection of diseases has intuitive assumption any deviations—subtle or apparent—from a clearly demarcated “normal” were to be corrected, given the underlying hypothesis that diseases develop along progressive linear paths of increasing abnormalities. However, now it is understood that screening of non-symptomatic subjects may even do more harm (160,162).
Challenges and forward looking
A number of RF pulse cluster for T1ρ prep have been proposed to improve the robustness of T1ρ prep against system imperfection. Comprehensive studies to compare these methods can help users to choose the right approach for specific study. Despite the significant improvement of robustness of T1ρ prep at the presence of B1 RF and B0 field inhomogeneity, residual artifacts can still be observed at certain cases with these methods. Further work is still needed to improve the effectiveness of T1ρ prep RF pulses in terms of compensation of B1 RF and B0 field inhomogeneity.
Various data acquisition methods have been reported for data acquisition in T1ρ imaging, with a few of them for 3D quantitative T1ρ imaging (12-14,16). Different data acquisition may result in different T1ρ value. A systematic study to compare these methods and understand the pros and cons of each of them can be very beneficial to setup a norm for T1ρ imaging in the field.
For routine clinical use, the establishment of the reproducibility of T1rho measurement is essential. A few reproducibility studies have been carried out recently (72,164). It will be very beneficial to have comprehensive reproducibility studies performed with different time span, at different system, at systems from different vendors, and at different sites.
The change of T1rho value between the healthy state and diseased state can be small. However, the sources which cause errors of T1ρ quantification are multiple, including B1 RF inhomogeneity and B0 field inhomogeneity and data acquisition. With the demand of fast data acquisition and high spatial resolution, it inevitably results in loss of SNR, which increases the risks of quantification error. Without providing confidence level of measured T1ρ value, it is difficult for users to make clinical diagnosis based on measured T1rho map. It is one of the major challenges to establish such confidence level in quantitative T1rho imaging.
A major application of T1ρ is in cartilage. However, the presence of magic angle effect can confound its use. Magic angle effect may be mitigated by increasing spin lock frequency (165). However, the maximum spin lock frequency available in a clinical scanner is limited by the power of RF amplifier and SAR. Further investigation may be needed to address magic angle effect. In cartilage, there usually exist three groups of tissues with ultra-shot, intermediate, and long T1ρ relaxation, respectively. Typically measured T1ρ value is the average of the intermediate and long T1ρ value. Multi-component analysis may help improve the diagnostic value of T1ρ, but at cost of scan time. Further technical work to improve data acquisition speed for multi-component analysis is needed.
Acknowledgements
The authors thank Mr. Wang Junqing for the help during manuscript preparation.
Funding: This study was partially supported by grants from the Research Grants Council of the Hong Kong SAR (Project No. 476313 and Project No. SEG_CUHK02).
Footnote
Conflicts of Interest: The authors have no conflicts of interest to declare.
References
- Redfield AG. Nuclear magnetic resonance saturation and rotary saturation in solids. Phys Rev 1955;98:1787.
- Markkola A. Spin lock and Magentization transfer imaging of head and neck tumors. Academic Dissertation. Faculty of Medicine of the University of Helsinki, Helsinki 2003. Available online: https://helda.helsinki.fi/bitstream/handle/10138/22600/spinlock.pdf?sequence=2
- Sepponen RE, Pohjonen JA, Sipponen JT, Tanttu JI. A method for T1 rho imaging. J Comput Assist Tomogr 1985;9:1007-11. [PubMed]
- Markkola AT, Aronen HJ, Paavonen T, Hopsu E, Sipilä LM, Tanttu JI, Sepponen RE. Spin lock and magnetization transfer imaging of head and neck tumors. Radiology 1996;200:369-75. [PubMed]
- Hulvershorn J, Borthakur A, Bloy L, Gualtieri EE, Reddy R, Leigh JS, Elliott MA. T1rho contrast in functional magnetic resonance imaging. Magn Reson Med 2005;54:1155-62. [PubMed]
- Charagundla SR, Borthakur A, Leigh JS, Reddy R. Artifacts in T(1rho)-weighted imaging: correction with a self-compensating spin-locking pulse. J Magn Reson 2003;162:113-21. [PubMed]
- Yuan J, Li Y, Zhao F, Chan Q, Ahuja AT, Wang YX. Quantification of T(1ρ) relaxation by using rotary echo spin-lock pulses in the presence of B(0) inhomogeneity. Phys Med Biol 2012;57:5003-16. [PubMed]
- Witschey WR 2nd, Borthakur A, Elliott MA, Mellon E, Niyogi S, Wallman DJ, Wang C, Reddy R. Artifacts in T1 rho-weighted imaging: compensation for B(1) and B(0) field imperfections. J Magn Reson 2007;186:75-85. [PubMed]
- Li Y, Zhao F, Wang YX, Ahuja AT, Yuan J. Study of magnetization evolution by using composite spin-lock pulses for T1ρ imaging. Conf Proc IEEE Eng Med Biol Soc 2012;2012:408-11.
- Li X, Han ET, Ma CB, Link TM, Newitt DC, Majumdar S. In vivo 3T spiral imaging based multi-slice T(1rho) mapping of knee cartilage in osteoarthritis. Magn Reson Med 2005;54:929-36. [PubMed]
- Chen W, Takahashi A, Han E. Quantitative T(1)(ρ) imaging using phase cycling for B0 and B1 field inhomogeneity compensation. Magn Reson Imaging 2011;29:608-19. [PubMed]
- Borthakur A, Wheaton A, Charagundla SR, Shapiro EM, Regatte RR, Akella SV, Kneeland JB, Reddy R. Three-dimensional T1rho-weighted MRI at 1.5 Tesla. J Magn Reson Imaging 2003;17:730-6. [PubMed]
- Li X, Han ET, Busse RF, Majumdar S. In vivo T(1rho) mapping in cartilage using 3D magnetization-prepared angle-modulated partitioned k-space spoiled gradient echo snapshots (3D MAPSS). Magn Reson Med 2008;59:298-307. [PubMed]
- Chen WT, Han ET. 3D quantitative imaging of T1rho and T2. Proc Annual Meeting ISMRM 2011;231.
- Duvvuri U, Charagundla SR, Kudchodkar SB, Kaufman JH, Kneeland JB, Rizi R, Leigh JS, Reddy R. Human knee: in vivo T1(rho)-weighted MR imaging at 1.5 T--preliminary experience. Radiology 2001;220:822-6. [PubMed]
- Witschey WR, Borthakur A, Elliott MA, Fenty M, Sochor MA, Wang C, Reddy R. T1rho-prepared balanced gradient echo for rapid 3D T1rho MRI. J Magn Reson Imaging 2008;28:744-54. [PubMed]
- Collins CM, Li S, Smith MB. SAR and B1 field distributions in a heterogeneous human head model within a birdcage coil. Specific energy absorption rate. Magn Reson Med 1998;40:847-56. [PubMed]
- Yuan J, Zhao F, Griffith JF, Chan Q, Wang YX. Optimized efficient liver T(1ρ) mapping using limited spin lock times. Phys Med Biol 2012;57:1631-40. [PubMed]
- Griswold MA, Jakob PM, Heidemann RM, Nittka M, Jellus V, Wang J, Kiefer B, Haase A. Generalized autocalibrating partially parallel acquisitions (GRAPPA). Magn Reson Med 2002;47:1202-10. [PubMed]
- Pruessmann KP, Weiger M, Scheidegger MB, Boesiger P. SENSE: sensitivity encoding for fast MRI. Magn Reson Med 1999;42:952-62. [PubMed]
- Sodickson DK, Manning WJ. Simultaneous acquisition of spatial harmonics (SMASH): fast imaging with radiofrequency coil arrays. Magn Reson Med 1997;38:591-603. [PubMed]
- Liang D, DiBella EV, Chen RR, Ying L. k-t ISD: dynamic cardiac MR imaging using compressed sensing with iterative support detection. Magn Reson Med 2012;68:41-53. [PubMed]
- Lustig M, Donoho D, Pauly JM. Sparse MRI: The application of compressed sensing for rapid MR imaging. Magn Reson Med 2007;58:1182-95. [PubMed]
- Yuan J, Liang D, Zhao F, Li Y, Wang YX, Ying L. k-t ISD compressed sensing reconstruction for T1ñ mapping: A study in rat brains at 3T. Proc Intl Soc Mag Reson Med 2012.4197.
- Wheaton AJ, Borthakur A, Corbo M, Charagundla SR, Reddy R. Method for reduced SAR T1rho-weighted MRI. Magn Reson Med 2004;51:1096-102. [PubMed]
- Yuan J, Zhao TC, Tang Y, Panych LP. Reduced field-of-view single-shot fast spin echo imaging using two-dimensional spatially selective radiofrequency pulses. J Magn Reson Imaging 2010;32:242-8. [PubMed]
- Rieseberg S, Frahm J, Finsterbusch J. Two-dimensional spatially-selective RF excitation pulses in echo-planar imaging. Magn Reson Med 2002;47:1186-93. [PubMed]
- Zhu Y. Parallel excitation with an array of transmit coils. Magn Reson Med 2004;51:775-84. [PubMed]
- Jokivarsi KT, Niskanen JP, Michaeli S, Gröhn HI, Garwood M, Kauppinen RA, Gröhn OH. Quantitative assessment of water pools by T 1 rho and T 2 rho MRI in acute cerebral ischemia of the rat. J Cereb Blood Flow Metab 2009;29:206-16. [PubMed]
- Mäkelä HI, Kettunen MI, Gröhn OH, Kauppinen RA. Quantitative T(1rho) and magnetization transfer magnetic resonance imaging of acute cerebral ischemia in the rat. J Cereb Blood Flow Metab 2002;22:547-58. [PubMed]
- Gröhn OH, Lukkarinen JA, Silvennoinen MJ, Pitkänen A, van Zijl PC, Kauppinen RA. Quantitative magnetic resonance imaging assessment of cerebral ischemia in rat using on-resonance T(1) in the rotating frame. Magn Reson Med 1999;42:268-76. [PubMed]
- Gröhn OHJ, Kettunen MI, Mäkelä HI, Penttonen M, Pitkänen A, Lukkarinen JA, Kauppinen RA. Early detection of irreversible cerebral ischemia in the rat using dispersion of the magnetic resonance imaging relaxation time, T1rho. J Cereb Blood Flow Metab 2000;20:1457-66. [PubMed]
- Nestrasil I, Michaeli S, Liimatainen T, Rydeen CE, Kotz CM, Nixon JP, Hanson T, Tuite PJ. T1rho and T2rho MRI in the evaluation of Parkinson's disease. J Neurol 2010;257:964-8. [PubMed]
- Haris M, Singh A, Cai K, McArdle E, Fenty M, Davatzikos C, Trojanowski JQ, Melhem ER, Clark CM, Borthakur A. T. (1ρ) MRI in Alzheimer's disease: detection of pathological changes in medial temporal lobe. J Neuroimaging 2011;21:e86-90. [PubMed]
- Haris M, Singh A, Cai K, Davatzikos C, Trojanowski JQ, Melhem ER, Clark CM, Borthakur A. T1rho (T1ρ) MR imaging in Alzheimer's disease and Parkinson's disease with and without dementia. J Neurol 2011;258:380-5. [PubMed]
- Haris M, McArdle E, Fenty M, Singh A, Davatzikos C, Trojanowski JQ, Melhem ER, Clark CM, Borthakur A. Early marker for Alzheimer's disease: hippocampus T1rho (T(1rho)) estimation. J Magn Reson Imaging 2009;29:1008-12. [PubMed]
- Borthakur A, Sochor M, Davatzikos C, Trojanowski JQ, Clark CM. T1rho MRI of Alzheimer's disease. Neuroimage 2008;41:1199-205. [PubMed]
- Zhao F, Yuan J, Lu G, Zhang LH, Chen ZY, Wáng YJ. T1ρ relaxation time in brain regions increases with ageing: an experimental MRI observation in rats. Br J Radiol 2016;89:20140704. [PubMed]
- Han Y, Liimatainen T, Gorman RC, Witschey WR. Assessing Myocardial Disease Using T1ρ MRI. Curr Cardiovasc Imaging Rep 2014;7:9248. [PubMed]
- Witschey WR, Zsido GA, Koomalsingh K, Kondo N, Minakawa M, Shuto T, McGarvey JR, Levack MM, Contijoch F, Pilla JJ, Gorman JH 3rd, Gorman RC. In vivo chronic myocardial infarction characterization by spin locked cardiovascular magnetic resonance. J Cardiovasc Magn Reson 2012;14:37. [PubMed]
- Singh A, Reddy D, Haris M, Cai K, Reddy KR, Hariharan H, Reddy R. T1 rho MRI of healthy and fibrotic human livers at 1.5 T. J Transl Med 2015;13:292. [PubMed]
- Wang YX, Yuan J. Evaluation of liver fibrosis with T1ρ MR imaging. Quant Imaging Med Surg 2014;4:152-5. [PubMed]
- Allkemper T, Sagmeister F, Cicinnati V, Beckebaum S, Kooijman H, Kanthak C, Stehling C, Heindel W. Evaluation of fibrotic liver disease with whole-liver T1ρ MR imaging: a feasibility study at 1.5 T. Radiology 2014;271:408-15. [PubMed]
- Zhao F, Wang YX, Yuan J, Deng M, Wong HL, Chu ES, Go MY, Teng GJ, Ahuja AT, Yu J. MR. T1ρ as an imaging biomarker for monitoring liver injury progression and regression: an experimental study in rats with carbon tetrachloride intoxication. Eur Radiol 2012;22:1709-16. [PubMed]
- Wang YX, Yuan J, Chu ES, Go MY, Huang H, Ahuja AT, Sung JJ, Yu J. T1rho MR imaging is sensitive to evaluate liver fibrosis: an experimental study in a rat biliary duct ligation model. Radiology 2011;259:712-9. [PubMed]
- Virta A, Komu M, Lundbom N, Kormano M. T1 rho MR imaging characteristics of human anterior tibial and gastrocnemius muscles. Acad Radiol 1998;5:104-10. [PubMed]
- Lamminen AE, Tanttu JI, Sepponen RE, Pihko H, Korhola OA. T1 rho dispersion imaging of diseased muscle tissue. Br J Radiol 1993;66:783-7. [PubMed]
- Sierra A, Michaeli S, Niskanen JP, Valonen PK, Gröhn HI, Ylä-Herttuala S, Garwood M, Gröhn OH. Water spin dynamics during apoptotic cell death in glioma gene therapy probed by T1rho and T2rho. Magn Reson Med 2008;59:1311-9. [PubMed]
- Wang YX, Zhao F, Griffith JF, Mok GS, Leung JC, Ahuja AT, Yuan J. T1rho and T2 relaxation times for lumbar disc degeneration: an in vivo comparative study at 3.0-Tesla MRI. Eur Radiol 2013;23:228-34. [PubMed]
- Wang L, Regatte RR. T1ρ MRI of human musculoskeletal system. J Magn Reson Imaging 2015;41:586-600. [PubMed]
- Murphy L, Schwartz TA, Helmick CG, Renner JB, Tudor G, Koch G, Dragomir A, Kalsbeek WD, Luta G, Jordan JM. Lifetime risk of symptomatic knee osteoarthritis. Arthritis Rheum 2008;59:1207-13. [PubMed]
- Helmick CG, Felson DT, Lawrence RC, Gabriel S, Hirsch R, Kwoh CK, Liang MH, Kremers HM, Mayes MD, Merkel PA, Pillemer SR, Reveille JD, Stone JH. National Arthritis Data Workgroup. Estimates of the prevalence of arthritis and other rheumatic conditions in the United States. Part I. Arthritis Rheum 2008;58:15-25. [PubMed]
- Murray CJ, Vos T, Lozano R, Naghavi M, Flaxman AD, Michaud C, Ezzati M, Shibuya K, Salomon JA, Abdalla S, Aboyans V, Abraham J, Ackerman I, Aggarwal R, Ahn SY, Ali MK, Alvarado M, Anderson HR, Anderson LM, Andrews KG, Atkinson C, Baddour LM, Bahalim AN, Barker-Collo S, Barrero LH, Bartels DH, Basáñez MG, Baxter A, Bell ML, Benjamin EJ, Bennett D, Bernabé E, Bhalla K, Bhandari B, Bikbov B, Bin Abdulhak A, Birbeck G, Black JA, Blencowe H, Blore JD, Blyth F, Bolliger I, Bonaventure A, Boufous S, Bourne R, Boussinesq M, Braithwaite T, Brayne C, Bridgett L, Brooker S, Brooks P, Brugha TS, Bryan-Hancock C, Bucello C, Buchbinder R, Buckle G, Budke CM, Burch M, Burney P, Burstein R, Calabria B, Campbell B, Canter CE, Carabin H, Carapetis J, Carmona L, Cella C, Charlson F, Chen H, Cheng AT, Chou D, Chugh SS, Coffeng LE, Colan SD, Colquhoun S, Colson KE, Condon J, Connor MD, Cooper LT, Corriere M, Cortinovis M, de Vaccaro KC, Couser W, Cowie BC, Criqui MH, Cross M, Dabhadkar KC, Dahiya M, Dahodwala N, Damsere-Derry J, Danaei G, Davis A, De Leo D, Degenhardt L, Dellavalle R, Delossantos A, Denenberg J, Derrett S, Des Jarlais DC, Dharmaratne SD, Dherani M, Diaz-Torne C, Dolk H, Dorsey ER, Driscoll T, Duber H, Ebel B, Edmond K, Elbaz A, Ali SE, Erskine H, Erwin PJ, Espindola P, Ewoigbokhan SE, Farzadfar F, Feigin V, Felson DT, Ferrari A, Ferri CP, Fèvre EM, Finucane MM, Flaxman S, Flood L, Foreman K, Forouzanfar MH, Fowkes FG, Fransen M, Freeman MK, Gabbe BJ, Gabriel SE, Gakidou E, Ganatra HA, Garcia B, Gaspari F, Gillum RF, Gmel G, Gonzalez-Medina D, Gosselin R, Grainger R, Grant B, Groeger J, Guillemin F, Gunnell D, Gupta R, Haagsma J, Hagan H, Halasa YA, Hall W, Haring D, Haro JM, Harrison JE, Havmoeller R, Hay RJ, Higashi H, Hill C, Hoen B, Hoffman H, Hotez PJ, Hoy D, Huang JJ, Ibeanusi SE, Jacobsen KH, James SL, Jarvis D, Jasrasaria R, Jayaraman S, Johns N, Jonas JB, Karthikeyan G, Kassebaum N, Kawakami N, Keren A, Khoo JP, King CH, Knowlton LM, Kobusingye O, Koranteng A, Krishnamurthi R, Laden F, Lalloo R, Laslett LL, Lathlean T, Leasher JL, Lee YY, Leigh J, Levinson D, Lim SS, Limb E, Lin JK, Lipnick M, Lipshultz SE, Liu W, Loane M, Ohno SL, Lyons R, Mabweijano J, MacIntyre MF, Malekzadeh R, Mallinger L, Manivannan S, Marcenes W, March L, Margolis DJ, Marks GB, Marks R, Matsumori A, Matzopoulos R, Mayosi BM, McAnulty JH, McDermott MM, McGill N, McGrath J, Medina-Mora ME, Meltzer M, Mensah GA, Merriman TR, Meyer AC, Miglioli V, Miller M, Miller TR, Mitchell PB, Mock C, Mocumbi AO, Moffitt TE, Mokdad AA, Monasta L, Montico M, Moradi-Lakeh M, Moran A, Morawska L, Mori R, Murdoch ME, Mwaniki MK, Naidoo K, Nair MN, Naldi L, Narayan KM, Nelson PK, Nelson RG, Nevitt MC, Newton CR, Nolte S, Norman P, Norman R, O'Donnell M, O'Hanlon S, Olives C, Omer SB, Ortblad K, Osborne R, Ozgediz D, Page A, Pahari B, Pandian JD, Rivero AP, Patten SB, Pearce N, Padilla RP, Perez-Ruiz F, Perico N, Pesudovs K, Phillips D, Phillips MR, Pierce K, Pion S, Polanczyk GV, Polinder S, Pope CA. 3rd, Popova S, Porrini E, Pourmalek F, Prince M, Pullan RL, Ramaiah KD, Ranganathan D, Razavi H, Regan M, Rehm JT, Rein DB, Remuzzi G, Richardson K, Rivara FP, Roberts T, Robinson C, De Leòn FR, Ronfani L, Room R, Rosenfeld LC, Rushton L, Sacco RL, Saha S, Sampson U, Sanchez-Riera L, Sanman E, Schwebel DC, Scott JG, Segui-Gomez M, Shahraz S, Shepard DS, Shin H, Shivakoti R, Singh D, Singh GM, Singh JA, Singleton J, Sleet DA, Sliwa K, Smith E, Smith JL, Stapelberg NJ, Steer A, Steiner T, Stolk WA, Stovner LJ, Sudfeld C, Syed S, Tamburlini G, Tavakkoli M, Taylor HR, Taylor JA, Taylor WJ, Thomas B, Thomson WM, Thurston GD, Tleyjeh IM, Tonelli M, Towbin JA, Truelsen T, Tsilimbaris MK, Ubeda C, Undurraga EA, van der Werf MJ, van Os J, Vavilala MS, Venketasubramanian N, Wang M, Wang W, Watt K, Weatherall DJ, Weinstock MA, Weintraub R, Weisskopf MG, Weissman MM, White RA, Whiteford H, Wiebe N, Wiersma ST, Wilkinson JD, Williams HC, Williams SR, Witt E, Wolfe F, Woolf AD, Wulf S, Yeh PH, Zaidi AK, Zheng ZJ, Zonies D, Lopez AD, AlMazroa MA, Memish ZA. Disability-adjusted life yeaALYs) for 291 diseases and injuries in 21 regions, 1990-2010: a systematic analysis for the Global Burden of Disease Study 2010. Lancet 2012;380:2197-223. [PubMed]
- Mankin HJ, Brandt KD. Pathogenesis of arthritis. Textbook of Rheumatology. Philadelphia: W.B. Saunders, 1993.
- Li X, Majumdar S. Quantitative MRI of articular cartilage and its clinical applications. J Magn Reson Imaging 2013;38:991-1008. [PubMed]
- Matzat SJ, van Tiel J, Gold GE, Oei EH. Quantitative MRI techniques of cartilage composition. Quant Imaging Med Surg 2013;3:162-74. [PubMed]
- Link TM, Stahl R, Woertler K. Cartilage imaging: motivation, techniques, current and future significance. Eur Radiol 2007;17:1135-46. [PubMed]
- Potter HG, Black BR. Chong le R. New techniques in articular cartilage imaging. Clin Sports Med 2009;28:77-94. [PubMed]
- Akella SV, Regatte RR, Gougoutas AJ, Borthakur A, Shapiro EM, Kneeland JB, Leigh JS, Reddy R. Proteoglycan-induced changes in T1rho-relaxation of articular cartilage at 4T. Magn Reson Med 2001;46:419-23. [PubMed]
- Regatte RR, Akella SV, Borthakur A, Kneeland JB, Reddy R. Proteoglycan depletion-induced changes in transverse relaxation maps of cartilage: comparison of T2 and T1rho. Acad Radiol 2002;9:1388-94. [PubMed]
- Akella SV, Regatte RR, Wheaton AJ, Borthakur A, Reddy R. Reduction of residual dipolar interaction in cartilage by spin-lock technique. Magn Reson Med 2004;52:1103-9. [PubMed]
- Li X, Cheng J, Lin K, Saadat E, Bolbos RI, Jobke B, Ries MD, Horvai A, Link TM, Majumdar S. Quantitative MRI using T1ρ and T2 in human osteoarthritic cartilage specimens: correlation with biochemical measurements and histology. Magn Reson Imaging 2011;29:324-34. [PubMed]
- Regatte RR, Akella SV, Lonner JH, Kneeland JB, Reddy R. T1rho relaxation mapping in human osteoarthritis (OA) cartilage: comparison of T1rho with T2. J Magn Reson Imaging 2006;23:547-53. [PubMed]
- Wheaton AJ, Dodge GR, Elliott DM, Nicoll SB, Reddy R. Quantification of cartilage biomechanical and biochemical properties via T1rho magnetic resonance imaging. Magn Reson Med 2005;54:1087-93. [PubMed]
- Tang SY, Souza RB, Ries M, Hansma PK, Alliston T, Li X. Local tissue properties of human osteoarthritic cartilage correlate with magnetic resonance T(1) rho relaxation times. J Orthop Res 2011;29:1312-9. [PubMed]
- Rautiainen J, Nissi MJ, Salo EN, Tiitu V, Finnilä MA, Aho OM, Saarakkala S, Lehenkari P, Ellermann J, Nieminen MT. Multiparametric MRI assessment of human articular cartilage degeneration: Correlation with quantitative histology and mechanical properties. Magn Reson Med 2014. Epub ahead of print. [PubMed]
- Keenan KE, Besier TF, Pauly JM, Smith RL, Delp SL, Beaupre GS, Gold GE. T1ρ Dispersion in Articular Cartilage: Relationship to Material Properties and Macromolecular Content. Cartilage 2015;6:113-22. [PubMed]
- Mäkelä HI, Gröhn OH, Kettunen MI, Kauppinen RA. Proton exchange as a relaxation mechanism for T1 in the rotating frame in native and immobilized protein solutions. Biochem Biophys Res Commun 2001;289:813-8. [PubMed]
- Duvvuri U, Goldberg AD, Kranz JK, Hoang L, Reddy R, Wehrli FW, Wand AJ, Englander SW, Leigh JS. Water magnetic relaxation dispersion in biological systems: the contribution of proton exchange and implications for the noninvasive detection of cartilage degradation. Proc Natl Acad Sci U S A 2001;98:12479-84. [PubMed]
- Kettunen MI, Gröhn OH, Silvennoinen MJ, Penttonen M, Kauppinen RA. Effects of intracellular pH, blood, and tissue oxygen tension on T1rho relaxation in rat brain. Magn Reson Med 2002;48:470-7. [PubMed]
- Mlynárik V, Szomolányi P, Toffanin R, Vittur F, Trattnig S. Transverse relaxation mechanisms in articular cartilage. J Magn Reson 2004;169:300-7. [PubMed]
- Li X, Wyatt C, Rivoire J, Han E, Chen W, Schooler J, Liang F, Shet K, Souza R, Majumdar S. Simultaneous acquisition of T1ρ and T2 quantification in knee cartilage: repeatability and diurnal variation. J Magn Reson Imaging 2014;39:1287-93. [PubMed]
- Mosher TJ, Zhang Z, Reddy R, Boudhar S, Milestone BN, Morrison WB, Kwoh CK, Eckstein F, Witschey WR, Borthakur A. Knee articular cartilage damage in osteoarthritis: analysis of MR image biomarker reproducibility in ACRIN-PA 4001 multicenter trial. Radiology 2011;258:832-42. [PubMed]
- Li X, Pedoia V, Kumar D, Rivoire J, Wyatt C, Lansdown D, Amano K, Okazaki N, Savic D, Koff MF, Felmlee J, Williams SL, Majumdar S. Cartilage T1ρ and T2 relaxation times: longitudinal reproducibility and variations using different coils, MR systems and sites. Osteoarthritis Cartilage 2015;23:2214-23. [PubMed]
- Stahl R, Luke A, Li X, Carballido-Gamio J, Ma CB, Majumdar S, Link TM. T1rho, T2 and focal knee cartilage abnormalities in physically active and sedentary healthy subjects versus early OA patients--a 3.0-Tesla MRI study. Eur Radiol 2009;19:132-43. [PubMed]
- Kumar D, Souza RB, Subburaj K, MacLeod TD, Singh J, Calixto NE, Nardo L, Link TM, Li X, Lane NE, Majumdar S. Are There Sex Differences in Knee Cartilage Composition and Walking Mechanics in Healthy and Osteoarthritis Populations? Clin Orthop Relat Res 2015;473:2548-58. [PubMed]
- Regatte RR, Akella SV, Wheaton AJ, Lech G, Borthakur A, Kneeland JB, Reddy R. 3D-T1rho-relaxation mapping of articular cartilage: in vivo assessment of early degenerative changes in symptomatic osteoarthritic subjects. Acad Radiol 2004;11:741-9. [PubMed]
- Li X, Benjamin Ma C, Link TM, Castillo DD, Blumenkrantz G, Lozano J, Carballido-Gamio J, Ries M, Majumdar S. In vivo T(1rho) and T(2) mapping of articular cartilage in osteoarthritis of the knee using 3 T MRI. Osteoarthritis Cartilage 2007;15:789-97. [PubMed]
- Bolbos RI, Zuo J, Banerjee S, Link TM, Ma CB, Li X, Majumdar S. Relationship between trabecular bone structure and articular cartilage morphology and relaxation times in early OA of the knee joint using parallel MRI at 3 T. Osteoarthritis Cartilage 2008;16:1150-9. [PubMed]
- Wang L, Chang G, Xu J, Vieira RL, Krasnokutsky S, Abramson S, Regatte RR. T1rho MRI of menisci and cartilage in patients with osteoarthritis at 3T. Eur J Radiol 2012;81:2329-36. [PubMed]
- Thuillier DU, Souza RB, Wu S, Luke A, Li X, Feeley BT. T1ρ imaging demonstrates early changes in the lateral patella in patients with patellofemoral pain and maltracking. Am J Sports Med 2013;41:1813-8. [PubMed]
- Nishioka H, Hirose J, Okamoto N, Okada T, Oka K, Taniwaki T, Nakamura E, Yamashita Y, Mizuta H. Evaluation of the relationship between T1ρ and T2 values and patella cartilage degeneration in patients of the same age group. Eur J Radiol 2015;84:463-8. [PubMed]
- Lozano J, Li X, Link TM, Safran M, Majumdar S, Ma CB. Detection of posttraumatic cartilage injury using quantitative T1rho magnetic resonance imaging. A report of two cases with arthroscopic findings. J Bone Joint Surg Am 2006;88:1349-52. [PubMed]
- Witschey WR, Borthakur A, Fenty M, Kneeland BJ, Lonner JH, McArdle EL, Sochor M, Reddy R. T1rho MRI quantification of arthroscopically confirmed cartilage degeneration. Magn Reson Med 2010;63:1376-82. [PubMed]
- Nishioka H, Hirose J, Nakamura E, Okamoto N, Karasugi T, Taniwaki T, Okada T, Yamashita Y, Mizuta H. Detecting ICRS grade 1 cartilage lesions in anterior cruciate ligament injury using T1ρ and T2 mapping. Eur J Radiol 2013;82:1499-505. [PubMed]
- Gupta R, Virayavanich W, Kuo D, Su F, Link T, Ma B, Li X. MR T. (1)ρ quantification of cartilage focal lesions in acutely injured knees: correlation with arthroscopic evaluation. Magn Reson Imaging 2014;32:1290-6. [PubMed]
- Holtzman DJ, Theologis AA, Carballido-Gamio J, Majumdar S, Li X, Benjamin C. T. (1ρ) and T(2) quantitative magnetic resonance imaging analysis of cartilage regeneration following microfracture and mosaicplasty cartilage resurfacing procedures. J Magn Reson Imaging 2010;32:914-23. [PubMed]
- Theologis AA, Schairer WW, Carballido-Gamio J, Majumdar S, Li X, Ma CB. Longitudinal analysis of T1ρ and T2 quantitative MRI of knee cartilage laminar organization following microfracture surgery. Knee 2012;19:652-7. [PubMed]
- Jungmann PM, Baum T, Bauer JS, Karampinos DC, Erdle B, Link TM, Li X, Trattnig S, Rummeny EJ, Woertler K, Welsch GH. Cartilage repair surgery: outcome evaluation by using noninvasive cartilage biomarkers based on quantitative MRI techniques? Biomed Res Int 2014;2014:840170.
- Carballido-Gamio J, Link TM, Majumdar S. New techniques for cartilage magnetic resonance imaging relaxation time analysis: texture analysis of flattened cartilage and localized intra- and inter-subject comparisons. Magn Reson Med 2008;59:1472-7. [PubMed]
- Carballido-Gamio J, Stahl R, Blumenkrantz G, Romero A, Majumdar S, Link TM. Spatial analysis of magnetic resonance T1rho and T2 relaxation times improves classification between subjects with and without osteoarthritis. Med Phys 2009;36:4059-67. [PubMed]
- Li X, Pai A, Blumenkrantz G, Carballido-Gamio J, Link T, Ma B, Ries M, Majumdar S. Spatial distribution and relationship of T1rho and T2 relaxation times in knee cartilage with osteoarthritis. Magn Reson Med 2009;61:1310-8. [PubMed]
- Schooler J, Kumar D, Nardo L, McCulloch C, Li X, Link TM, Majumdar S. Longitudinal evaluation of T1ρ and T2 spatial distribution in osteoarthritic and healthy medial knee cartilage. Osteoarthritis Cartilage 2014;22:51-62. [PubMed]
- Zarins ZA, Bolbos RI, Pialat JB, Link TM, Li X, Souza RB, Majumdar S. Cartilage and meniscus assessment using T1rho and T2 measurements in healthy subjects and patients with osteoarthritis. Osteoarthritis Cartilage 2010;18:1408-16. [PubMed]
- Takahashi K, Hashimoto S, Nakamura H, Mori A, Sato A, Majima T, Takai S. Medial meniscal posterior root/horn radial tears correlate with cartilage degeneration detected by T1ρ relaxation mapping. Eur J Radiol 2015;84:1098-104. [PubMed]
- Matsubara H, Okazaki K, Takayama Y, Osaki K, Matsuo Y, Honda H, Iwamoto Y. Detection of early cartilage deterioration associated with meniscal tear using T1ρ mapping magnetic resonance imaging. BMC Musculoskelet Disord 2015;16:22. [PubMed]
- Li X, Ma BC, Bolbos RI, Stahl R, Lozano J, Zuo J, Lin K, Link TM, Safran M, Majumdar S. Quantitative assessment of bone marrow edema pattern and overlying cartilage in knees with osteoarthritis and anterior cruciate ligament tear using MR imaging and spectroscopic imaging. J Magn Reson Imaging 2008;28:453-61. [PubMed]
- Zhao J, Li X, Bolbos RI, Link TM, Majumdar S. Longitudinal assessment of bone marrow edema-like lesions and cartilage degeneration in osteoarthritis using 3 T MR T1rho quantification. Skeletal Radiol 2010;39:523-31. [PubMed]
- Bolbos RI, Ma CB, Link TM, Majumdar S, Li X. In vivo T1rho quantitative assessment of knee cartilage after anterior cruciate ligament injury using 3 Tesla magnetic resonance imaging. Invest Radiol 2008;43:782-8. [PubMed]
- Li X, Kuo D, Theologis A, Carballido-Gamio J, Stehling C, Link TM, Ma CB, Majumdar S. Cartilage in anterior cruciate ligament-reconstructed knees: MR imaging T1{rho} and T2--initial experience with 1-year follow-up. Radiology 2011;258:505-14. [PubMed]
- Theologis AA, Kuo D, Cheng J, Bolbos RI, Carballido-Gamio J, Ma CB, Li X. Evaluation of bone bruises and associated cartilage in anterior cruciate ligament-injured and -reconstructed knees using quantitative t(1ρ) magnetic resonance imaging: 1-year cohort study. Arthroscopy 2011;27:65-76. [PubMed]
- Klocke NF, Amendola A, Thedens DR, Williams GN, Luty CM, Martin JA, Pedersen DR. Comparison of T1ρ, dGEMRIC, and quantitative T2 MRI in preoperative ACL rupture patients. Acad Radiol 2013;20:99-107. [PubMed]
- Su F, Hilton JF, Nardo L, Wu S, Liang F, Link TM, Ma CB, Li X. Cartilage morphology and T1ρ and T2 quantification in ACL-reconstructed knees: a 2-year follow-up. Osteoarthritis Cartilage 2013;21:1058-67. [PubMed]
- Haughom B, Schairer W, Souza RB, Carpenter D, Ma CB, Li X. Abnormal tibiofemoral kinematics following ACL reconstruction are associated with early cartilage matrix degeneration measured by MRI T1rho. Knee 2012;19:482-7. [PubMed]
- Zaid M, Lansdown D, Su F, Pedoia V, Tufts L, Rizzo S, Souza RB, Li X, Ma CB. Abnormal tibial position is correlated to early degenerative changes one year following ACL reconstruction. J Orthop Res 2015;33:1079-86. [PubMed]
- Kumar D, Kothari A, Souza RB, Wu S, Benjamin Ma C, Li X. Frontal plane knee mechanics and medial cartilage MR relaxation times in individuals with ACL reconstruction: A pilot study. Knee 2014;21:881-5. [PubMed]
- Neidhart M, Müller-Ladner U, Frey W, Bosserhoff AK, Colombani PC, Frey-Rindova P, Hummel KM, Gay RE, Häuselmann H, Gay S. Increased serum levels of non-collagenous matrix proteins (cartilage oligomeric matrix protein and melanoma inhibitory activity) in marathon runners. Osteoarthritis Cartilage 2000;8:222-9. [PubMed]
- Vanwanseele B, Eckstein F, Knecht H, Spaepen A, Stüssi E. Longitudinal analysis of cartilage atrophy in the knees of patients with spinal cord injury. Arthritis Rheum 2003;48:3377-81. [PubMed]
- Hagiwara Y, Ando A, Chimoto E, Saijo Y, Ohmori-Matsuda K, Itoi E. Changes of articular cartilage after immobilization in a rat knee contracture model. J Orthop Res 2009;27:236-42. [PubMed]
- Luke AC, Stehling C, Stahl R, Li X, Kay T, Takamoto S, Ma B, Majumdar S, Link T. High-field magnetic resonance imaging assessment of articular cartilage before and after marathon running: does long-distance running lead to cartilage damage? Am J Sports Med 2010;38:2273-80. [PubMed]
- Stehling C, Luke A, Stahl R, Baum T, Joseph G, Pan J, Link TM. Meniscal T1rho and T2 measured with 3.0T MRI increases directly after running a marathon. Skeletal Radiol 2011;40:725-35. [PubMed]
- Peers SC, Maerz T, Baker EA, Shetty A, Xia Y, Puwal S, Marcantonio D, Keyes D, Guettler J. T1ρ magnetic resonance imaging for detection of early cartilage changes in knees of asymptomatic collegiate female impact and nonimpact athletes. Clin J Sport Med 2014;24:218-25. [PubMed]
- Wang L, Vieira RL, Rybak LD, Babb JS, Chang G, Krasnokutsky S, Abramson S, Regatte R. Relationship between knee alignment and T1ρ values of articular cartilage and menisci in patients with knee osteoarthritis. Eur J Radiol 2013;82:1946-52. [PubMed]
- Souza RB, Stehling C, Wyman BT, Hellio Le Graverand MP, Li X, Link TM, Majumdar S. The effects of acute loading on T1rho and T2 relaxation times of tibiofemoral articular cartilage. Osteoarthritis Cartilage 2010;18:1557-63. [PubMed]
- Subburaj K, Kumar D, Souza RB, Alizai H, Li X, Link TM, Majumdar S. The acute effect of running on knee articular cartilage and meniscus magnetic resonance relaxation times in young healthy adults. Am J Sports Med 2012;40:2134-41. [PubMed]
- Souza RB, Kumar D, Calixto N, Singh J, Schooler J, Subburaj K, Li X, Link TM, Majumdar S. Response of knee cartilage T1rho and T2 relaxation times to in vivo mechanical loading in individuals with and without knee osteoarthritis. Osteoarthritis Cartilage 2014;22:1367-76. [PubMed]
- Zhu Y, Zhang Q, Liu Q, Wang YX, Liu X, Zheng H, Liang D, Yuan J. PANDA- T1ρ: Integrating principal component analysis and dictionary learning for fast T1ρ mapping. Magn Reson Med 2015;73:263-72. [PubMed]
- Pandit P, Rivoire J, King K, Li X. Accelerated T1ρ acquisition for knee cartilage quantification using compressed sensing and data-driven parallel imaging: A feasibility study. Magn Reson Med 2015. Epub ahead of print. [PubMed]
- Zhou Y, Pandit P, Pedoia V, Rivoire J, Wang Y, Liang D, Li X, Ying L. Accelerating t1ρ cartilage imaging using compressed sensing with iterative locally adapted support detection and JSENSE. Magn Reson Med 2015. Epub ahead of print. [PubMed]
- Pedoia V, Li X, Su F, Calixto N, Majumdar S. Voxel Based Relaxometry (T1ρ) of the Knee Articular Cartilage: A Comparison of Patterns of Biochemical Changes in Knees with Mild Osteoarthritis and Anterior Cruciate Ligament Injury. J Magn Reson Imaging 2015. In press. [PubMed]
- Shan L, Zach C, Charles C, Niethammer M. Automatic atlas-based three-label cartilage segmentation from MR knee images. Med Image Anal 2014;18:1233-46. [PubMed]
- Carballido-Gamio J, Link TM, Li X, Han ET, Krug R, Ries MD, Majumdar S. Feasibility and reproducibility of relaxometry, morphometric, and geometrical measurements of the hip joint with magnetic resonance imaging at 3T. J Magn Reson Imaging 2008;28:227-35. [PubMed]
- Rakhra KS, Lattanzio PJ, Cárdenas-Blanco A, Cameron IG, Beaulé PE. Can T1-rho MRI detect acetabular cartilage degeneration in femoroacetabular impingement?: a pilot study. J Bone Joint Surg Br 2012;94:1187-92. [PubMed]
- Subburaj K, Valentinitsch A, Dillon AB, Joseph GB, Li X, Link TM, Vail TP, Majumdar S. Regional variations in MR relaxation of hip joint cartilage in subjects with and without femoralacetabular impingement. Magn Reson Imaging 2013;31:1129-36. [PubMed]
- Wyatt C, Kumar D, Subburaj K, Lee S, Nardo L, Narayanan D, Lansdown D, Vail T, Link TM, Souza RB, Majumdar S. Cartilage T1ρ and T2 Relaxation Times in Patients With Mild-to-Moderate Radiographic Hip Osteoarthritis. Arthritis Rheumatol 2015;67:1548-56. [PubMed]
- McGuffin WS, Melkus G, Rakhra KS, Beaulé PE. Is the contralateral hip at risk in patients with unilateral symptomatic cam femoroacetabular impingement? A quantitative T1ρ MRI study. Osteoarthritis Cartilage 2015;23:1337-42. [PubMed]
- Al Maini M, Adelowo F, Al Saleh J, Al Weshahi Y, Burmester GR, Cutolo M, Flood J, March L, McDonald-Blumer H, Pile K, Pineda C, Thorne C, Kvien TK. The global challenges and opportunities in the practice of rheumatology: white paper by the World Forum on Rheumatic and Musculoskeletal Diseases. Clin Rheumatol 2015;34:819-29. [PubMed]
- Dagenais S, Caro J, Haldeman S. A systematic review of low back pain cost of illness studies in the United States and internationally. Spine J 2008;8:8-20. [PubMed]
- Fehlings MG, Tetreault L, Nater A, Choma T, Harrop J, Mroz T, Santaguida C, Smith JS. The Aging of the Global Population: The Changing Epidemiology of Disease and Spinal Disorders. Neurosurgery 2015;77 Suppl 4:S1-5. [PubMed]
- Miller JA, Schmatz C, Schultz AB. Lumbar disc degeneration: correlation with age, sex, and spine level in 600 autopsy specimens. Spine (Phila Pa 1976) 1988;13:173-8. [PubMed]
- Łebkowski WJ. Autopsy evaluation of the extent of degeneration of the lumbar intervertebral discs. Pol Merkur Lekarski 2002;13:188-90. [PubMed]
- Wáng YX. Continued progression of lumbar disc degeneration in postmenopausal women. Climacteric 2015;18:435. [PubMed]
- Wang YX. Postmenopausal Chinese women show accelerated lumbar disc degeneration compared with Chmen. Journal of Orthopaedic Translation 2015;3:205-11.
- Johannessen W, Auerbach JD, Wheaton AJ, Kurji A, Borthakur A, Reddy R, Elliott DM. Assessment of human disc degeneration and proteoglycan content using T1rho-weighted magnetic resonance imaging. Spine (Phila Pa 1976) 2006;31:1253-7. [PubMed]
- Blumenkrantz G, Li X, Han ET, Newitt DC, Crane JC, Link TM, Majumdar S. A feasibility study of in vivo T1rho imaging of the intervertebral disc. Magn Reson Imaging 2006;24:1001-7. [PubMed]
- Griffith JF, Wang YX, Antonio GE, Choi KC, Yu A, Ahuja AT, Leung PC. Modified Pfirrmann grading system for lumbar intervertebral disc degeneration. Spine (Phila Pa 1976) 2007;32:E708-12. [PubMed]
- Pfirrmann CW, Metzdorf A, Zanetti M, Hodler J, Boos N. Magnetic resonance classification of lumbar intervertebral disc degeneration. Spine (Phila Pa 1976) 2001;26:1873-8. [PubMed]
- Wang YX, Griffith JF, Leung JC, Yuan J. Age related reduction of T1rho and T2 magnetic resonance relaxation times of lumbar intervertebral disc. Quant Imaging Med Surg 2014;4:259-64. [PubMed]
- Vadalà G, Russo F, Battisti S, Stellato L, Martina F, Del Vescovo R, Giacalone A, Borthakur A, Zobel BB, Denaro V. Early intervertebral disc degeneration changes in asymptomatic weightlifters assessed by t1ρ-magnetic resonance imaging. Spine (Phila Pa 1976) 2014;39:1881-6. [PubMed]
- Brayda-Bruno M, Tibiletti M, Ito K, Fairbank J, Galbusera F, Zerbi A, Roberts S, Wachtel E, Merkher Y, Sivan SS. Advances in the diagnosis of degenerated lumbar discs and their possible clinical application. Eur Spine J 2014;23 Suppl 3:S315-23. [PubMed]
- Endean A, Palmer KT, Coggon D. Potential of magnetic resonance imaging findings to refine case definition for mechanical low back pain in epidemiological studies: a systematic review. Spine (Phila Pa 1976) 2011;36:160-9. [PubMed]
- Ogon I, Takebayashi T, Takashima H, Tanimoto K, Ida K, Yoshimoto M, Fujiwara H, Kubo T, Yamashita T. Analysis of chronic low back pain with magnetic resonance imaging T2 mapping of lumbar intervertebral disc. J Orthop Sci 2015;20:295-301. [PubMed]
- Wang YX, Griffith JF. Biomedical imaging in translational orthopaedic research. Journal of Orthopaedic Translation 2015;3:157-9.
- Salzmann GM, Erdle B, Porichis S, Uhl M, Ghanem N, Schmal H, Kubosch D, Südkamp NP, Niemeyer P. Long-term T2 and Qualitative MRI Morphology After First-Generation Knee Autologous Chondrocyte Implantation: Cartilage Ultrastructure Is Not Correlated to Clinical or Qualitative MRI Outcome. Am J Sports Med 2014;42:1832-40. [PubMed]
- de Windt TS, Welsch GH, Brittberg M, Vonk L, Marlovits S, Trattnig S, Saris DB, Blackman AJ, Smith MV, Flanigan DC, Matava MJ, Wright RW, Brophy RH. Correlation between magnetic resonance imaging and clinical outcomes after knee cartilage repair: letter to the editor. Am J Sports Med 2013;41:NP48-50. [PubMed]
- de Windt TS, Welsch GH, Brittberg M, Vonk LA, Marlovits S, Trattnig S, Saris DB. Is magnetic resonance imaging reliable in predicting clinical outcome after articular cartilage repair of the knee? A systematic review and meta-analysis. Am J Sports Med 2013;41:1695-702. [PubMed]
- Yuan J, Wang YX. A general T1ρ relaxation model for spin-lock MRI using a rotary echo pulse. Proc Intl Soc Mag Reson Med 2011.124.
- Wang YX, Zhao F, Yuan J, Mok GS, Ahuja AT, Griffith JF. Accelerated T1rho relaxation quantification in intervertebral disc using limited spin-lock times. Quant Imaging Med Surg 2013;3:54-8. [PubMed]
- Johnson CP, Thedens DR, Magnotta VA. Precision-guided sampling schedules for efficient T1ρ mapping. J Magn Reson Imaging 2015;41:242-50. [PubMed]
- Yuan J, Li Y, Zhao F, Chan Q, Ahuja AT, Wang YX. Quantification of T(1ρ) relaxation by using rotary echo spin-lock pulses in the presence of B(0) inhomogeneity. Phys Med Biol 2012;57:5003-16. [PubMed]
- Yuan J, Zhao F, Chan Q, Wang YX. Observation of bi-exponential T(1ρ) relaxation of in-vivo rat muscles at 3T. Acta Radiol 2012;53:675-81. [PubMed]
- Wang YX, Deng M. Medical imaging in new drug clinical development. J Thorac Dis 2010;2:245-52. [PubMed]
- Wang YX. Medical imaging in pharmaceutical clinical trials: what radiologists should know. Clin Radiol 2005;60:1051-7. [PubMed]
- Raastad J, Reiman M, Coeytaux R, Ledbetter L, Goode AP. The association between lumbar spine radiographic features and low back pain: a systematic review and meta-analysis. Semin Arthritis Rheum 2015;44:571-85. [PubMed]
- Blumenkrantz G, Zuo J, Li X, Kornak J, Link TM, Majumdar S. In vivo 3.0-tesla magnetic resonance T1rho and T2 relaxation mapping in subjects with intervertebral disc degeneration and clinical symptoms. Magn Reson Med 2010;63:1193-200. [PubMed]
- Müller-Lutz A, Schleich C, Pentang G, Schmitt B, Lanzman RS, Matuschke F, Wittsack HJ, Miese F. Age-dependency of glycosaminoglycan content in lumbar discs: A 3t gagcEST study. J Magn Reson Imaging 2015. Epub ahead of print. [PubMed]
- Wang YX, Mok G, Zhang D, Chen SZ, Yuan J. A comparison of three approaches for defining nucleus pulposus and annulus fibrosus on sagittal MR images. Proc Intl Soc Mag Reson Med 2015;23:1217.
- Wáng YX. Inner annulus fibrosus in non-degenerated intervertebral disc shows bright signal on T2 weighted MR image. Quant Imaging Med Surg 2014;4:504. [PubMed]
- Mulligan KR, Ferland CE, Gawri R, Borthakur A, Haglund L, Ouellet JA. Axial T1ρ MRI as a diagnostic imaging modality to quantify proteoglycan concentration in degenerative disc disease. Eur Spine J 2015;24:2395-401. [PubMed]
- Croswell JM, Ransohoff DF, Kramer BS. Principles of cancer screening: lessons from history and study design issues. Semin Oncol 2010;37:202-15. [PubMed]
- Esserman L, Shieh Y, Thompson I. Rethinking screening for breast cancer and prostate cancer. JAMA 2009;302:1685-92. [PubMed]
- Marcus PM, Bergstralh EJ, Fagerstrom RM, Williams DE, Fontana R, Taylor WF, Prorok PC. Lung cancer mortality in the Mayo Lung Project: impact of extended follow-up. J Natl Cancer Inst 2000;92:1308-16. [PubMed]
- Wáng YX, Gong JS, Loffroy R. On pancreatic cancer screening by magnetic resonance imaging with the recent evidence by Del Chiaro and colleagues. Chin J Cancer Res 2015;27:417-22. [PubMed]
- Jordan CD, McWalter EJ, Monu UD, Watkins RD, Chen W, Bangerter NK, Hargreaves BA, Gold GE. Variability of CubeQuant T1ρ, quantitative DESS T2, and cones sodium MRI in knee cartilage. Osteoarthritis Cartilage 2014;22:1559-67. [PubMed]
- Reddy R, Insko EK, Kaufman JH, Bolinger L, Kneeland JB, Leigh JS. MR Imaging of Articular Cartilage Under Spin-Locking. Proc Annual Meeting ISMRM 1995:1535.

