

Reproducibility of quantitative susceptibility mapping in lumbar vertebra
Introduction
Quantitative susceptibility mapping (QSM) has been widely applied to assess magnetic susceptibility sources in many different tissues of the human body, including vascular, inflammatory, and neurodegenerative diseases in the brain and applications outside the brain (1-8). The quantitative nature of the technique can provide biomarkers that allow the clinical monitoring of disease diagnosis, progression, and treatment effects. As such, QSM is increasingly being used to quantify strong diamagnetic susceptibility of densely calcified tissues such as bone (9-11). Thus, QSM may have the ability to assess the changes in bone mineral content and to become an imaging diagnostic tool of bone health.
However, the chemical shift caused by fatty tissues is a main technical challenge in the application of QSM in the bones. The chemical shift complicates the magnetic resonance imaging (MRI) signal, and further affects the QSM quantification (12). Another challenge is that bone has extremely short transverse relaxation time. There is a very low signal at the bone with conventional echo times (TE) in gradient echo (GRE) imaging, resulting in a barely meaningful phase for QSM reconstruction (10). To acquire the rapidly decaying signal of bone water, the combination of ultrashort TE (UTE) and conventional TE were used in the data acquisition.
In clinical, the diagnosis of osteoporosis is based on measurements of bone mineral density (BMD) using dual X-ray absorptiometry (DXA) and quantitative computed tomography (QCT). DXA determines BMD in two dimensions, while QCT is superior to DXA in measuring trabecular bones by three-dimensional imaging without superimposition of cortical bone and other tissues, and thus it is more sensitive in diagnosing or evaluating the response of therapy (13,14). However, both DXA and QCT are radioactive methods. Quantitative MR techniques without ionizing radiation have been emerging to quantify changes in bone marrow composition and to assist in diagnosing osteoporosis.
A previous study showed that QSM is available in measuring the susceptibility in the lumbar vertebra (15). However, there is no study to investigate its reliability and reproducibility. Therefore, this study aims to evaluate the reliability and reproducibility of QSM in the lumbar vertebra.
Methods
The review board of our institution approved this prospective study. Written informed consent had obtained from each patient before the study enrollment.
Study population
Between May and September 2017, a total of 61 subjects was enrolled in this study, with a mean age of 55.5 years (ranging from 20 to 79 years). The inclusion criteria for this study were as follows: (I) without preexisting bone disease (such as tumor, metastases, or metabolic disorder); (II) without vertebral abnormality (e.g., vertebral fracture); (III) received no previous medication therapy that could affect bone density; and (IV) had no implants contraindicated for QCT and QSM-MRI examinations. The exclusion criteria were as follows: (I) retained metal in anywhere of the body; (II) had claustrophobia; (III) could not keep still during examinations; and (IV) lesions (e.g., hemangioma, lipoma) occasionally found in the targeted vertebra.
QCT examination
A QCT examination of the L1–L5 in the supine position was performed on a 64-CT scanner (Aquilion 64, Toshiba, Tokyo, Japan) on all subjects. The scanning parameters were as follows: tube voltage =120 kV, tube current =250 mA, slice thickness = 5 mm, field of view (FOV) =50 cm × 50 cm, in-plane pixel size =0.98 mm × 0.98 mm.
QSM examination
MRI of the lumbar spine in the supine position was performed on a 3.0-T MR system (Philips, Achieva, The Netherlands) using a 16-channel posterior coil. For evaluating the inter-scan reproducibility of QSM, UTE-GRE was acquired two times (Scan 1 and Scan 2) with interval of less than 1 week for each subject using the following parameters: non-selective radio frequency (RF) pulse (flip angle =25o, duration =0.1 ms), TR =20 ms, TE =0.142, 2.4, 4.6, 6.8 ms, readout bandwidth =957 Hz/per pixel, radial projections =41,136, voxel size =1 mm × 1 mm × 2 mm, matrix size =256 × 256 × 75. The total acquisition time was approximately 9 min for each scan.
Data analysis
QCT images were reconstructed to obtain volume data with a thickness of 1.25 mm, a window width of 400 Hu (Hounsfield unit), window level of 40 Hu, and FOV of 50 cm. Volume data were then sent to QCT PRO workstation and analyzed using the QCT PRO 5.0.3 (Mindways Software Inc., Austin, USA). For QCT measurement, elliptical regions of interest (ROI) was automatically placed on the midplane of L1–L4 vertebral bodies except for fractured one and avoided the cortical bone. The QCT values were independently measured by two observers with experiences more than 10 years in bone. The diagnosis in questionable cases was determined by consensus. The subjects were divided into three groups according to the QCT value (normal: QCT ≥120 mg/cm3; osteopenia: 80 mg/cm3 ≤ QCT <120 mg/cm3; osteoporosis: QCT <80 mg/cm3). Mean QCT value is expressed in milligrams per cubic centimeter of calcium hydroxyapatite. For the QCT value of spinal trabecular bone, thresholds of 120 mg/cm3 for osteopenia and 80 mg/cm3 for osteoporosis were suggested by the International Society for Clinical Densitometry in 2007.
For QSM measurement, the field map estimation in the presence of both water and fat in the vertebral body is commonly solved as an energy minimization problem, with unknown’s water fraction ρ, a susceptibility induced field inhomogeneity fs and a signal decay rate  .
.
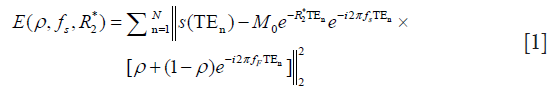
where s(TEn) is the signal acquired at echo time TEn, N is the number of echoes. For in-phase TE, the Eq. [1] becomes:

Thus, the total field map was obtained from complex MR signals using nonlinear least squares fitting method (16) without regarding the effect of chemical shift because of water-fat in the same direction at the acquired in-phased TE and was unwrapped with a continuous Laplacian approach (17). Projection onto dipole fields was used for background field removal (18). Finally, susceptibility maps were estimated with the norm1-regularization, dipole inversion formulation solved by the split-Bregman (19). The correlation coefficient between QCT and QSM with various regularization parameters was calculated in L1–L4. For evaluating the reliability of QSM, the ROI within the L1–L4 vertebral bodies was manually drawn in the Scan 1 by two radiologists (Observer 1 and Observer 2) with more than 10 years in diagnostic imaging experience. Also, the ROI within the L1–L4 vertebral bodies was manually drawn in Scan 2 by Observer 1 for reproducibility evaluation.
Statistical analysis
All measurements were documented and saved in Excel (Microsoft, Redmond, WA, USA). Normality testing was performed using the Shapiro-Wilk test and homogeneity of variance testing using the Levene test. Numerical data are reported as the mean ± standard deviation (SD) of all three sets of measurement. Differences between the three groups (normal, osteopenia and osteoporosis groups) were compared using one-way ANOVA followed with Bonferroni post hoc multiple comparisons and if ANCOVA when controlling for covariates. The Pearson correlation coefficient between QCT and QSM values and between QSM values obtained from two different observers or scans was calculated in L1–L4. The intraclass correlation coefficient (ICC) and Bland-Altman plots were used to assess inter-observer reliability and inter-scan reproducibility on QSM. All statistical analysis was performed using IBM SPSS Statistics software version 23.0 (IBM Corp., Armonk, NY, USA).
Results
Patient baseline characteristics
A total of 61 subjects (52 female, 9 male, age range from 20 to 79 years, mean age 55.5±13.7 years) were enrolled in this study, 17 were normal (27.9%), 24 osteopenic (39.3%) and 20 osteoporotic (32.8%). The demographic and clinical characteristics of the three groups were shown in Table 1.

Full table
Correlation between QCT and QSM values
A moderate correlation was observed between QSM and QCT in the L1–L4 vertebral bodies with the strongest correlation coefficient of −0.75 in L3 (Table 2). With the regularization parameter λ =0.75×10⁻³ for QSM calculation, the strongest correlation coefficient (R=−0.75) between QCT and QSM can be obtained in both Scan 1 and Scan 2 (Figure 1A). The scatter plot between QCT and QSM values from 61 subjects were shown for Scan 1 (Figure 1B) and Scan 2 (Figure 1C). Figure 2 demonstrates the comparisons of mean QSM values obtained from three combinations (Scan 1 & Observer 1, Scan 1 & Observer 2, and Scan 2 & Observer 1) in the three groups divided by the QCT, which shows no significant differences (for all, P value >0.05).

Full table


Reliability and reproducibility of measurements
Figure 3A shows the magnitude image and QSM of repeated scans (Scan 1 and Scan 2) and the QCT image (Figure 3B) on a representative subject. The image quality is comparable, and the QSM is similar between Scan 1 and Scan 2, demonstrating the very good inter-scan reproducibility. In Figure 4A, excellent inter-observer reliability was observed in QSM values, with an ICC value of 0.992 (95% CI: 0.985–0.996). The inter-observer mean difference in QSM values was 0.35, with the 95% limits of agreement of −22.74 to 23.45 ppb for Scan 1 (Figure 4B).


Figure 5A showed very good inter-scan reproducibility in QSM values, with an ICC value of 0.932 (95% CI: 0.886–0.959). The inter-scan mean difference in QSM values was −7.60, with the 95% limits of agreement of −92.85 to 77.62 ppb (Figure 5B).

Discussion
In this study, we investigated the reliability and reproducibility of QSM in lumbar vertebra across young and aged subjects. The results showed that QSM has excellent inter-observer reliability and very good inter-scan reproducibility, demonstrating the feasibility of QSM for magnetic susceptibility quantification in the lumbar vertebra.
The previous researches showed that QSM values are consistent across different magnetic field strengths in the brain (20,21). In this study, we investigated the reliability and reproducibility of QSM in the lumbar vertebra at the same MRI system. The high ICC between two scans indicated very good reproducibility of QSM in the lumbar vertebra. Also, the result showed a moderate correlation between QSM and QCT, especially in the L3 vertebra (with a correlation coefficient of −0.75). Hence, QSM can reflect the changes in susceptibility due to the mineral changes during the development of osteoporosis in the general population of different ages and sexes.
Osteoporosis involves a gradual loss of bone mineral, namely calcium phosphate in the form of calcium hydroxylapatite. Since calcium hydroxylapatite is approximately 5.79 ppm more diamagnetic than water (22), the QSM value of vertebral bodies could be affected by the loss of calcium in osteoporosis (10,23). Also, bone marrow fat content also varies with different ages and could affect the diamagnetism of bone. These could explain that the QSM was increased with osteopenia and further increased with osteoporosis as compared to that of the healthy vertebra. Given all these beneficial properties to serve as reference factors in quantifying BMD, and which are finally represented as the changes in susceptibility value. Previous studies showed that bone magnetic susceptibility can be estimated with MRI and could be an alternative and reliable biomarker of BMD, measurements demonstrated that the observed increase in susceptibility in osteopenic and osteoporotic lumbar vertebrae is closely related to BMD (10,11,15,23). In particular, the R2* is used generally to measure the changes of magnetic susceptibility in bone marrow and it is found lower in osteoporotic patients, the reduction could be due to the reduced spatial inhomogeneities in the bone trabeculae and marrow interface (24). However, R2* measurements were affected by additional factors deoxyhemoglobin concentration, iron load, and fat content (25). In this study, QSM analysis was acquired using in-phase echoes to improve the signal-to-noise ratio because of the summation of water and fat signals and remove the effects of chemical shift, and it was successfully demonstrated the feasibility of quantifying susceptibility of the lumbar vertebral marrow using QSM value.
The susceptibility source in the measured QSM values, which is mainly from calcium in the bone marrow, is not expected to change between the Scan 1 and the Scan 2 during the short duration of the study, and QSM imaging parameters were identical across the two scans. Also, all of the data acquisition in this study was performed on the same scanner. These may explain the observed very good reproducibility of QSM in this work. To our best of knowledge, this is the first study to evaluate the feasibility and reproducibility of QSM in assessing lumbar vertebral body across different ages and sexes, and we achieved promising results. We found excellent reproducibility of QSM value in measuring BMD in lumbar vertebral bodies with referenced susceptibility between two operators and between two observers.
Imaging technology by assessing BMD is the principal method to diagnosis osteoporosis. As a gold standard, DXA has been used for measuring BMD in clinical diagnosing of osteoporosis for a long time, which determines BMD in two dimensions and is suspicious for reliability (26,27). QCT providing three-dimensional true volumetric trabecular bone measurements have been proposed to overcome limitations of DXA but still cannot be generalized for a much high dose of X-ray radiation (27). The changes in bone marrow composition affect QCT values (28), similarly as the influence factors in measuring QSM value. Besides, both QCT and QSM can provide three-dimensional images. Thus, QCT was used as a reference to evaluate QSM in this work.
This preliminary study also has some limitations. First, the data acquisition of UTE-based QSM needs 9 min, which is much longer than that of QCT. The data acquisition time may be substantially reduced by using sparse MRI strategies. Second, we only assessed the QSM processing in the lumbar spine. Finally, the QSM processing that is based on the assumption of the single-peak fat signal model (~440 Hz between water and fat) may result in small deviations on the field map. This issue can be addressed by using the multi-peak fat signal model for water-fat separation, which needs to be investigated in future work.
Conclusions
QSM could be used in assessing BMD across individuals with different ages and sexes. QSM was moderately correlated with QCT and had very good reproducibility. Therefore, QSM is a feasible and reproducible method for evaluating the susceptibility in the lumbar vertebra.
Acknowledgements
We acknowledge the help of Dr. Bin Zhang (the first affiliated hospital of Jinan University) with writing assistance and proofreading the article.
Funding: This study was supported by the National Natural Science Foundation of China (grant No. 81371539, 61671228, 61471188, and 81801653); Guangdong Science and Technology Department (grant No. 2017B090912006).
Footnote
Conflicts of Interest: The authors have no conflicts of interest to declare.
Ethical Statement: The review board of our institution approved this prospective study. Written informed consent had obtained from each patient before the study enrollment.
References
- Liu C, Li W, Tong KA, Yeom KW, Kuzminski S. Susceptibility-weighted imaging and quantitative susceptibility mapping in the brain. J Magn Reson Imaging 2015;42:23-41. [Crossref] [PubMed]
- Chen W, Gauthier SA, Gupta A, Comunale J, Liu T, Wang S, Pei M, Pitt D, Wang Y. Quantitative susceptibility mapping of multiple sclerosis lesions at various ages. Radiology 2014;271:183-92. [Crossref] [PubMed]
- Wisnieff C, Ramanan S, Olesik J, Gauthier S, Wang Y, Pitt D. Quantitative susceptibility mapping (QSM) of white matter multiple sclerosis lesions: Interpreting positive susceptibility and the presence of iron. Magn Reson Med 2015;74:564-70. [Crossref] [PubMed]
- Deistung A, Schweser F, Reichenbach JR. Overview of quantitative susceptibility mapping. NMR Biomed 2017;30:e3569. [Crossref] [PubMed]
- Chen W1. Zhu W, Kovanlikaya I, Kovanlikaya A, Liu T, Wang S, Salustri C, Wang Y. Intracranial calcifications and hemorrhages: characterization with quantitative susceptibility mapping. Radiology 2014;270:496-505. [Crossref]
- Ide S, Kakeda S, Ueda I, Watanabe K, Murakami Y, Moriya J, Ogasawara A, Futatsuya K, Sato T, Ohnari N, Okada K, Matsuyama A, Fujiwara H, Hisaoka M, Tsuji S, Liu T, Wang Y, Korogi Y. Internal structures of the globus pallidus in patients with Parkinson’s disease: evaluation with quantitative susceptibility mapping (QSM). Eur Radiol 2015;25:710-8. [Crossref] [PubMed]
- Schweser F, Sommer K, Deistung A, Reichenbach JR. Quantitative susceptibility mapping for investigating subtle susceptibility variations in the human brain. Neuroimage 2012;62:2083-100. [Crossref] [PubMed]
- Zhang J, Liu T, Gupta A, Spincemaille P, Nguyen TD, Wang Y. Quantitative mapping of cerebral metabolic rate of oxygen (CMRO2) using quantitative susceptibility mapping (QSM). Magn Reson Med 2015;74:945-52. [Crossref] [PubMed]
- Deistung A, Schweser F, Wiestler B, Abello M, Roethke M, Sahm F, Wick W, Nagel AM, Heiland S, Schlemmer HP, Bendszus M, Reichenbach JR, Radbruch A. Quantitative susceptibility mapping differentiates between blood depositions and calcifications in patients with glioblastoma. PloS One 2013;8:e57924. [Crossref] [PubMed]
- Dimov AV, Liu Z, Spincemaille P, Prince MR, Du J, Wang Y. Bone quantitative susceptibility mapping using a chemical species-specific R2* signal model with ultrashort and conventional echo data. Magn Reson Med 2018;79:121-8. [Crossref] [PubMed]
- Wei H, Dibb R, Decker K, Wang N, Zhang Y, Zong X, Lin W, Nissman DB, Liu C. Investigating magnetic susceptibility of human knee joint at 7 Tesla. Magn Reson Med 2017;78:1933-43. [Crossref] [PubMed]
- Dong J, Liu T, Chen F, Zhou D, Dimov A, Raj A, Cheng Q, Spincemaille P, Wang Y. Simultaneous phase unwrapping and removal of chemical shift (SPURS) using graph cuts: application in quantitative susceptibility mapping. IEEE Trans Med Imaging 2015;34:531-40. [Crossref] [PubMed]
- Li N, Li XM, Xu L, Sun WJ, Cheng XG, Tian W. Comparison of QCT and DXA: Osteoporosis Detection Rates in Postmenopausal Women. Int J Endocrinol 2013;2013:895474. [Crossref] [PubMed]
- Link TM, Lang TF. Axial QCT: clinical applications and new developments. J Clin Densitom 2014;17:438-48. [Crossref] [PubMed]
- Chen Y, Guo Y, Zhang X, Mei Y, Feng Y, Zhang X. Bone susceptibility mapping with MRI is an alternative and reliable biomarker of osteoporosis in postmenopausal women. Eur Radiol 2018;28:5027-34. [Crossref] [PubMed]
- Liu T, Wisnieff C, Lou M, Chen W, Spincemaille P, Wang Y. Nonlinear formulation of the magnetic field to source relationship for robust quantitative susceptibility mapping. Magn Reson Med 2013;69:467-76. [Crossref] [PubMed]
- Acosta-Cabronero J, Cardenas-Blanco A, Betts MJ, Butryn M, Valdes-Herrera JP, Galazky I, Nestor PJ. The whole-brain pattern of magnetic susceptibility perturbations in Parkinson's disease. Brain 2017;140:118-31. [Crossref] [PubMed]
- Liu T, Khalidov I, de Rochefort L, Spincemaille P, Liu J, Tsiouris AJ, Wang Y. A novel background field removal method for MRI using projection onto dipole fields (PDF). NMR Biomed 2011;24:1129-36. [Crossref] [PubMed]
- Bilgic B, Fan AP, Polimeni JR, Cauley SF, Bianciardi M, Adalsteinsson E, Wald LL, Setsompop K. Fast quantitative susceptibility mapping with L1-regularization and automatic parameter selection. Magn Reson Med 2014;72:1444-59. [Crossref] [PubMed]
- Deh K, Nguyen TD, Eskreis-Winkler S, Prince MR, Spincemaille P, Gauthier S, Kovanlikaya I, Zhang Y, Wang Y. Reproducibility of quantitative susceptibility mapping in the brain at two field strengths from two vendors. J Magn Reson Imaging 2015;42:1592-600. [Crossref] [PubMed]
- Hinoda T, Fushimi Y, Okada T, Fujimoto K, Liu C, Yamamoto A, Okada T, Kido A, Togashi K. Quantitative Susceptibility Mapping at 3 T and 1.5 T: Evaluation of Consistency and Reproducibility. Invest Radiol 2015;50:522-30. [Crossref] [PubMed]
- Hopkins JA, Wehrli FW. Magnetic susceptibility measurement of insoluble solids by NMR: magnetic susceptibility of bone. Magn Reson Med 1997;37:494-500. [Crossref] [PubMed]
- Wang Y, Spincemaille P, Liu Z, Dimov A, Deh K, Li J, Zhang Y, Yao Y, Gillen KM, Wilman AH, Gupta A, Tsiouris AJ, Kovanlikaya I, Chiang GC, Weinsaft JW, Tanenbaum L, Chen W, Zhu W, Chang S, Lou M, Kopell BH, Kaplitt MG, Devos D, Hirai T, Huang X, Korogi Y, Shtilbans A, Jahng GH, Pelletier D, Gauthier SA, Pitt D, Bush AI, Brittenham GM, Prince MR. Clinical quantitative susceptibility mapping (QSM): Biometal imaging and its emerging roles in patient care. J Magn Reson Imaging 2017;46:951-71. [Crossref] [PubMed]
- Kühn JP, Hernando D, Meffert PJ, Reeder S, Hosten N, Laqua R, Steveling A, Ender S, Schröder H, Pillich DT. Proton-density fat fraction and simultaneous R2* estimation as an MRI tool for assessment of osteoporosis. Eur Radiol 2013;23:3432-9. [Crossref] [PubMed]
- Sirlin CB, Reeder SB. Magnetic resonance imaging quantification of liver iron. Magn Reson Imaging Clin N Am 2010;18:359-81. [Crossref] [PubMed]
- Link TM. Osteoporosis imaging: state of the art and advanced imaging. Radiology 2012;263:3-17. [Crossref] [PubMed]
- Link TM. Radiology of Osteoporosis. Can Assoc Radiol J 2016;67:28-40. [Crossref] [PubMed]
- Peña JA, Thomsen F, Damm T, Campbell GM, Bastgen J, Barkmann R, Glüer CC. Bone-marrow densitometry: Assessment of marrow space of human vertebrae by single energy high resolution-quantitative computed tomography. Med Phys 2016;43:4174. [Crossref] [PubMed]

