
Implication of pulmonary-systemic flow information in the management of complex presentation of pulmonary arterial hypertension: exploring role of phase contrast MRI technique
Introduction
Phase-contrast (PC) cardiovascular magnetic resonance (MR) is an established technique which can measure, non-invasively, all three directional components of the velocities of blood flow relative to all four spatio-temporal dimensions of the heart and great vessels (1-4). The mapping of single component of “time-resolved velocity” directed perpendicularly through a 2D plane is extensively used for clinical measurements of flow volume (1-4). This technique provides measurements of forward, regurgitant and shunt flows in cardiovascular disease (5). Application of the same technology enables evaluation of flow across large aortic collaterals. Thus a measure of shunting between systemic to pulmonary (S-P) circulation or otherwise can be quantitatively obtained. Here we present a clinical example wherein information obtained from PC technique greatly assisted in the better understanding of patho-physiological basis of a uncommon clinical presentation.
Case presentation
A 21-year-old lady presented with progressive breathlessness since childhood. She had no orthopnea, nocturnal dyspnoea or syncope. She gave history of multiple episodes of hemoptysis and epistaxis. She had surgery for patent ductus arteriosus (PDA) correction at age of 5 years. Her symptoms started 7–8 years after surgery, following which she had repeated hospitalization due to breathing difficulty. She also suffered from a depressive syndrome.
On examination she was conscious and coherent; weighed 40 kg, pulse: 96 beats/min, regular. All peripheral pulses were felt. BP was measured 100/70 mmHg both the upper limbs in sitting position. Jugular venous pressure was elevated, showing “a” and “v” waves. She had cyanosis and clubbing of right upper limb and both lower limb, sparing the left upper limb. Pulse oxymetry revealed right upper limb saturation of 52%, 87% on left and 78% and 77% in right and left lower limbs (Figure 1).

On cardiovascular examination, there was a precordial bulge, palpable P2, left parasternal heave and loud P2. 3/6 ejection systolic murmur was noted in the pulmonary area. Lungs revealed bilateral basal crepitation. Pulmonary function test showed forced expiratory volume 1—1.33 (52%), forced vital capacity (FVC)—2.13 (79%), forced expiratory volume 1/FVC%—62.4, maximum expiratory flow (MEF): 25–75%—0.72 (18%) indicating moderate obstruction. Diffusion studies showed DLco-80%. Lab parameters were normal. Echocardiography demonstrated dilated right atrium (RA), right ventricle (RV) and right ventricular hypertrophy (RVH). On bubble contrast 2D echo, contrast was seen in 2nd cycle in the descending thoracic aorta. No intra-cardiac R-L shunts or residual flow in the PDA was visible. CT images showed gross dilatation of main pulmonary artery (MPA). There was selective opacification of distal aorta during pulmonary arterial phase, skipping the proximal part (Figure 2A,B). There were multiple, large collateral vessels from right pulmonary artery (RPA) to right subclavian artery (RSA) and MP/left pulmonary artery (LPA) to descending aorta (Figure 2C,D).

Cardiac MRI images consisted of conventional and uni-directionally encoded (through-plane) velocity, PC images at superior vena cava (SVC)-inferior vena cava (IVC), proximal and distal aorta, MPA and both PA (Figure 3). Sites of measurement are shown in Figure 4. Quantity of flow was determined at different levels by Q-flow technique (Table 1). Expected normal inflow of right heart, flow in pulmonary arteries and ascending aorta is similar, which is measured as combined flow in SVC + IVC and flow at aortic root. We observed an additional 10.4 mL flow at distal aortic level, representing shunt from pulmonary to systemic circulation. Estimated flow into upper body was 8.4 mL (1.9+3.5+3 mL), flow at ascending aorta 20 mL and descending aorta 22 mL. Thus structural and flow related imaging information from CT and MR examinations helped to document pulmonary to systemic shunt of 10.4 mL/sec by collateral arteries. Based on MR input, palliative surgical shunt was considered redundant in view of large quantity of spontaneous shunt. Patient was recommended for lung transplantation or combined heart-lung transplantation for alleviation of pulmonary arterial hypertension.


Full table
Discussion
The measurement of single component of time-resolved velocity directed sequence (perpendicularly through a 2D plane) is extensively used for clinical measurements of flow in intra and extracardiac sites (1-4). PC MRI is a well-established technique for obtaining quantitative information on blood flow. A PC MRI technique with addition of 4D PC imaging has a definitive role in the evaluation of pulmonary hypertension (6). Conventional MRI examination provides well established morphological cardiac parameters. Addition of MR-PC techniques allows prediction of flow across pulmonary and tricuspid valves, at various sites within pulmonary arteries, at pulmonary veins and within ventricular chambers. 2D PC imaging technique provides time-resolved velocity information in a single predominant direction of fluid motion whereas 4D PC imaging maps complete three directional, time-resolved velocity field in a volume of interest (6). 4D PC data allows calculation of maximal velocities, peak velocities, mean velocities, flow and flow-volume through the cross-section by defining cross-sections on multiplanar reconstructed image planes. Apart from flow information, additional parameters like pulmonary arterial pressure, pulmonary vascular resistance, parameters related to blood flow topology, pulse-wave propagation and wall shear stress in the pulmonary arterial vasculature can be derived (6). PC measurements can be either performed with breath hold or during breathing. Also prospective and retrospective gating techniques can be used for precise data acquisition. Errors inherent in the method includes mismatched encoding velocity, deviation of the imaging plane, inadequate temporal resolution, inadequate spatial resolution, accelerated flow, spatial mis-registration and phase offset errors. Most accurate flow measurements are possible if the imaging plane is perpendicular to the vessel of interest and flow encoding is set to through-plane flow. Examination is initially done with a high encoding velocity for peak velocity estimation, subsequently repeated for optimal measurement with an adapted encoding velocity. The overall error of a PC flow measurement is up to 10% due to errors during prescription and during image analysis of the flow data (1,2). This technique can be applied to evaluate flow in intra-thoracic vessels, neck arteries and estimation of systemic-pulmonary collateral flow (SPCF). Validation of flow measurement of SPCF has been attempted in patients with single ventricle with superior vena-cavo-pulmonary connection (7). Major limitation in estimating the SPCF has been the inability to accurately quantify the flow. Conventional angiography or CT angiography were used previously to demonstrate and crudely to estimate the extent of shunting. When accurate information is necessary for interventional procedures like coiling of collateral vessel, a robust method is necessary to define morphology of vessels, quantify the shunt and assess the efficacy of the procedure (7,8). Regarding SPCF estimation, Whitehead et al. (7) hypothesized two measurement options (I) the difference in ascending aortic (Ao) and total caval flow (SVC + IVC) and other (II) the difference between pulmonary venous and artery flow (PV-PA), providing two independent estimators of SPCF. Retrospectively gated, through-plane PC-MRI cine can be performed in the aorta, SVC, IVC, both pulmonary arteries and both pulmonary veins (RPV and LPV). The collateral flow can be calculated by the two different methods by the equations:
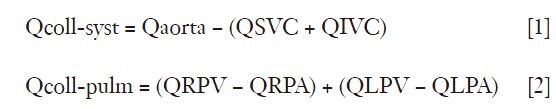
Where Qcoll-syst and Qcoll-pulm represent the estimated collateral flow by comparing supply and return of the systemic and pulmonary systems respectively. The collateral flow should be normalized to aortic flow to determine the percent of cardiac output; to body surface area (BSA) in order to obtain an indexed flow and to total pulmonary vein flow (QRPV + QLPV) to determine the percent of pulmonary flow from collateral flow. In addition, the total venous return to the heart was calculated (QIVC + QRPV + QLPV) to compare with the aortic flow as an indicator of internal consistency (7).
These measurement options provide scope for broader application of the technique to measure pulmonary to systemic shunts in congenital and acquired heart disease even with a slight variant anatomy and flow. Essentially systemic and pulmonary flow should the same in normal individuals. Any mismatch in flow is accounted by shunt circulation. We did not use flow data from pulmonary veins due to technical limitation of precise positioning region of interest (ROI). Our patient had a large collateral connecting RPA to RSA that contributed for right-sided cyanosis and clubbing. There was no significant pulmonary collateral flow to left upper limb, thus, sparing left upper limb from cyanosis and clubbing. On the other hand due to large quantity of desaturated blood in descending aorta, there was bilateral lower limb cyanosis and clubbing. CT and MRI imaging is often complementary. CT demonstrates vascular anatomy and improves delineation of collateral arteries. MR techniques provide flow information. It is important to note that measured values are only approximate in view of technical limitations, physiological variation, errors in MR application and complicated, poorly understood flow dynamics. However practical application of these options can be used in pre- and post-operative evaluation of cyanotic congenital heart disease with collateral flow. Demonstration of large quantity of spontaneous shunt, as seen in our patient may obviate the need of surgical shunt due to limited benefit. Hence alternative management strategy can be planned. In a broader clinical context, there is a scope for quantitative measurement of aorto-pulmonary collaterals in patients with other clinical entities like bronchiectasis, cystic fibrosis or bronco-pulmonary malformation.
Conclusions
An interesting clinical presentation of severe pulmonary arterial hypertension evaluated by PC MRI technique is presented. Typically, PC MRI examination provides clinically useful additional parameters regarding flow, pressure and vascular resistance within pulmonary arteries. This presentation highlights additional ability of the PC MRI technique to quantify flow through large pulmonary to systemic arterial collaterals, thus explaining complex clinical presentation in our patient. Scope of application of this technique in other clinical context is suggested.
Acknowledgements
The authors acknowledge and sincerely thank the contribution of Dr. Syed Zulkharnain Tousheed, from the Department of Pulmonary Medicine in the clinical workup of this patient.
Footnote
Conflicts of Interest: The authors have no conflicts of interest to declare.
Informed Consent: Written informed consent was obtained from the patient for publication of this manuscript and any accompanying images.
References
- Singer JR. Blood Flow Rates by Nuclear Magnetic Resonance Measurements. Science 1959;130:1652-3. [Crossref] [PubMed]
- Lotz J, Meier C, Leppert A, Galanski M. Cardiovascular flow measurement with phase-contrast MR imaging: basic facts and implementation. Radiographics 2002;22:651-71. [Crossref] [PubMed]
- Markl M, Kilner PJ, Ebbers T. Comprehensive 4D velocity mapping of the heart and great vessels by cardiovascular magnetic resonance. J Cardiovasc Magn Reson 2011;13:7. [Crossref] [PubMed]
- Kilner PJ, Henein MY, Gibson DG. Our tortuous heart in dynamic mode--an echocardiographic study of mitral flow and movement in exercising subjects. Heart Vessels 1997;12:103-10. [Crossref] [PubMed]
- Gatehouse PD, Keegan J, Crowe LA, Masood S, Mohiaddin RH, Kreitner KF, Firmin DN. Applications of phase-contrast flow and velocity imaging in cardiovascular MRI. Eur Radiol 2005;15:2172-84. [Crossref] [PubMed]
- Reiter U, Reiter G, Fuchsjäger M. MR phase-contrast imaging in pulmonary hypertension. Br J Radiol 2016;89:20150995. [Crossref] [PubMed]
- Whitehead KK, Gillespie MJ, Harris MA, Fogel MA, Rome JJ. Noninvasive quantification of systemic-to-pulmonary collateral flow: a major source of inefficiency in patients with superior cavopulmonary connections. Circ Cardiovasc Imaging 2009;2:405-11. [Crossref] [PubMed]
- Geva T. Quantification of systemic-to-pulmonary artery collateral flow: challenges and opportunities. Circ Cardiovasc Imaging 2012;5:175-7. [Crossref] [PubMed]

