
Correlation between pneumonitis risk in radiation oncology and lung density measured with X-ray computed tomography
Introduction
The quality of radiotherapy treatment plans in terms of probability of local control and the risk of toxicity can be evaluated using dose calculated metrics. Therefore, the knowledge of the relationship between the planned dose and the risk of toxicity is the essential information to validate the radiotherapy treatment plans. In this context, the estimation of the probability of developing radiation pneumonitis is a true concern for lung cancer treatment and very important information to protect the healthy tissues. The risk of toxicity limits the maximal radiation dose that can be delivered to thoracic tumors. The radiation pneumonitis, as a complication, occurs within the first 6 months after radiation therapy. Graduated symptoms can be observed as fever, dyspnea, cough and at the most, death from respiratory failure (1). Currently, there are several radiobiological models, based on mathematical and statistical concepts, to estimate the tumor control probability (TCP) as well as the normal tissue complication probability (NTCP) (2-9). Most theoretical models, that have been developed to estimate the benefits/risks balance, are based on physical dose distribution and the biological effect in normal tissue. However, the accuracy of the estimated TCP/NTCP depends on the accuracy of the assessment of the delivered dose as well as uncertainties related to the clinical data and dose calculation methods. The purpose of this paper is to evaluate and quantify the correlation between NTCP estimates and physical lung density. The NTCP was computed using dosimetric data derived from the patients’ dose volume histograms (DVH) with Lyman model.
Methods
Clinical cases and dose calculation
Data from computed tomography (CT-scans) in ten lung cancer patients, treated with 3-dimensional radiotherapy, were selected for this study. The clinical planning includes 5 to 8 beams.
The dosimetric results from DVH and dose calculations were performed, as described previously (10). The dose was calculated using treatment planning system (TPS) Eclipse® (Varian Medical Systems, Palo Alto, CA, USA) with analytical anisotropic algorithm (AAA) (11,12). Firstly, the cumulative DVHs were calculated, then, the (Di, vi) data pairs were obtained from the differential DVHs of each radiotherapy plan. To consider the dose per fraction effects, the physical dose distribution corresponding to each DVH bin, Di, was converted into the normalized total dose distribution (LQED) using the linear-quadratic model:

where “n” is the number of fractions. The α/β is the tissue-specific LQ parameter of the organ. The radiation pneumonitis, as a late effect, has a relatively high fractionation sensitivity and the best current estimate of the α/β ratio of the linear quadratic model is 4.0±0.9 Gy according to the literature. As the value of 3 is the most often used, for this study α/β was set as 3 Gy (13,14).
Lung density
The CT images were exported to TPS, and then the average Hounsfield unit (HU) value was calculated for lung. Next, the HU was converted to relative electronic density (ρw) using the following equation (15):

where ρw is the density relative to water measured using CT images.
NTCP
For the lung, radiation induced pneumonitis was selected as the most important endpoint for NTCP. The NTCP was calculated from LKB model; using the following Eqs [3-5]:
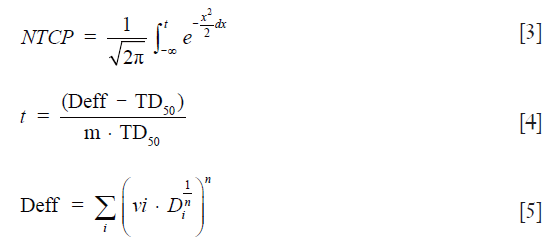
where Deff is the dose that, if given uniformly to the whole organ, would lead to the same NTCP as the actual non-uniform dose distribution. The NTCP is determined by three radiobiological parameters: TD50, m and n. TD50 is the uniform dose given to the entire organ volume that results in 50% complication risk, m is the slope of the sigmoid curve represented by the integral of the normal distribution and n describes the magnitude of the volume effect. For the lung, fitting the LKB model to clinical complication data usually yields values of “n” close to unity. The initial and readjusted radiobiological parameters for AAA were used and then the NTCP were compared (16-19). The initial radiobiological parameters were: n=0.87, m=0.18 and TD50=24.5 Gy. The readjusted parameters for AAA were: n=0.99, m=0.374 and TD50=29.19 Gy.
Statistical analysis
To measure the strength of the relationship between NTCP and density (i.e., estimate how much NTCP metrics and lung density are related), the correlation coefficient can be used. Spearman’s ‘rho’ correlation coefficient was used considering non-parametric data. We used the bootstrap method to determine the correlation and to estimate the 95% confidence interval (95% CI). This consisted in taking 1,000 random samplings of the same cohort. A Wilcoxon signed rank test was used to calculate the P value (20).
Results
Lung density
The 95% CI for HU and density have been computed using non-parametric bootstrapping with 1,000 replicates. Figure 1 shows an example of CT slice from one patient illustrating the region of interest (ROI) and the distribution of HU values of the contained pixels. The distribution in this ROI is shown in the histogram in Figure 1 and is setting −802 HU± 62 SD. Figure 2 shows the HU values and present lung density using box plot method.


NTCP outcomes
Figure 3 presents the NTCP values, predicting pneumonitis toxicity as endpoint, calculated using Lyman model with the initial radiobiological parameters assumed and readapted for AAA. In Figure 3, the 95% CI were estimated using bootstrap simulation based on 1,000 replications. Considering these results, the use of NTCP with adapted parameters for AAA would result in more toxicity for lung, with P=0.03. This difference may have a clinical impact on the patient.

Relationship between NTCP and lung density
The data from n=10 patients demonstrate that there is a weak correlation. The 95% CI of ‘rho’ was (0.30; 0.36), with P>0.1. However, bootstrap simulation method with 1,000 random samplings showed a very weak correlation. Specifically, Spearman’s rank ‘rho’ and R2 were less than 0.1, with P>0.2. Figure 4 shows the correlation using bootstrap simulation method with 1,000 random samplings. The weak correlation is due to the fact that patient’s number, included in this study, were insufficient to determine the nature of correlation. In addition, another important parameter is the bootstrap simulation with 1,000 random samplings was underestimated the correlation, since the initial data was n=10.

Discussion
There are numerous studies which recommend integrating carefully the NTCP models. They also report the need to assess or even readjust the model parameter values (21-23). More recently, Chaikh et al. 2016, reported that the change of dose calculation algorithms might be associated with the adjustment of the model parameters to better estimate the NTCP (24). They showed that the difference in dosimetric results due to change in dose calculation algorithm is more apparent in low-density heterogeneity, such as in the lung tissue, and DVH data with the more recent algorithms can better predict the NTCP. In this context, the tissue density correction is important for the accurate radiation dose calculation. In the thoracic tumor, there is a large density variation because of lung tissue and the transport electrons play an important role in dose calculation. Generally, the AAA considers the secondary electrons. However, the available dose calculation algorithms are not standard methods; they are regarded approximate to Monte Carol method. They have a many of limitations and they are not accurate as Monte Carol algorithm. In this paper, we illustrate different aspects of this question. First, we investigated the Lyman model to estimate the NTCP. Second, we evaluate the correlation between predicted NTCP with physical lung density. The comparison of NTCP, as first step, showed that the differences in NTCP were influenced by model parameters. A statistical evaluation based on Wilcoxon’s test showed a significant difference. In addition, the bootstrap simulation indicated that a significant difference between NTCP was observed with the same model but using different parameters such as TD50, n and m. However, the estimation of NTCP should include, although not done yet, individual patient specific parameters, such as lung density, age, disease state, comorbidities, associated treatments, etc. Thus, the relevant NTCP can be calculated using bootstrap simulation and logistic regression including all variables, which would be taken into account. In this case, the predictive NTCP model should be well correlate with the estimated NTCP from DVH, indicating ‘rho’ and coefficient of determination close to the unity. Therefore, a large number of patients should be included in such studies to achieve a good precision in the model parameter values. Since NTCP models are using DVH data, the most recent algorithms should be used in clinic and the NTCP model parameters adapted to them. Consequently, the main limit of this methodological and illustrative study is the patient number and did not take Monte Carol method as a standard algorithm to estimate the NTCP. These results may be useful to integrate the lung density in the NTCP model to predict the more accurate NTCP.
Conclusions
We assessed the correlation between NTCP from dose distribution metrics and physical lung density using bootstrap analysis. The results obtained from NTCP confirmed a probably weak correlation with lung density, with P>0.1. Considering 95% CI from bootstrap simulation, the coefficient of determination was <0.1.
Acknowledgements
None.
Footnote
Conflicts of Interest: The authors have no conflicts of interest to declare.
References
- Seppenwoolde Y, De Jaeger K, Boersma LJ, Belderbos JS, Lebesque JV. Regional differences in lung radiosensitivity after radiotherapy for non-small-cell lung cancer. Int J Radiat Oncol Biol Phys 2004;60:748-58. [Crossref] [PubMed]
- Lyman JT. Complication probability as assessed from dose-volume histograms. Radiat Res Suppl 1985;8:S13-9. [Crossref] [PubMed]
- Kutcher GJ, Burman C. Calculation of complication probability factors for non-uniform normal tissue irradiation: the effective volume method. Int J Radiat Oncol Biol Phys 1989;16:1623-30. [Crossref] [PubMed]
- Mohan R, Mageras GS, Baldwin B, Brewster LJ, Kutcher GJ, Leibel S, Burman CM, Ling CC, Fuks Z. Clinically relevant optimization of 3-D conformal treatments. Med Phys 1992;19:933-44. [Crossref] [PubMed]
- Deasy JO. Comments on the use of the Lyman-Kutcher-Burman model to describe tissue response to nonuniform irradiation. Int J Radiat Oncol Biol Phys 2000;47:1458-60. [Crossref] [PubMed]
- Niemierko A. A unified model of tissue response to radiation. Proceedings of the 41th AAPM annual meeting; 1999; Nashville, Tennessee: Med Phys, 1999:1100.
- Niemierko A. Reporting and analyzing dose distributions: a concept of equivalent uniform dose. Med Phys 1997;24:103-10. [Crossref] [PubMed]
- Niemierko A. A generalized concept of equivalent uniform dose (EUD). Med Phys 1999;26:1100.
- Allen Li X, Alber M, Deasy JO, Jackson A, Ken Jee KW, Marks LB, Martel MK, Mayo C, Moiseenko V, Nahum AE, Niemierko A, Semenenko VA, Yorke ED. The use and QA of biologically related models for treatment planning: short report of the TG-166 of the therapy physics committee of the AAPM. Med Phys 2012;39:1386-409. [Crossref] [PubMed]
- Chaikh A, Balosso J. Statistical evaluation of dosimetric differences changes between the Modified Batho's density correction method and the Anisotropic Analytical Algorithm for clinical practice. Int J Cancer Ther Oncol 2016;4:4217. [Crossref]
- Rana S. Clinical dosimetric impact of Acuros XB and analytical anisotropic algorithm (AAA) on real lung cancer treatment plans Int J Cancer Ther Oncol 2014;2:02019. review. [Crossref]
- Ojala J. The accuracy of the Acuros XB algorithm in external beam radiotherapy – a comprehensive review. Int J Cancer Ther Oncol 2014;2:020417. [Crossref]
- Tsujino K, Hirota S, Kotani Y, Kado T, Yoden E, Fujii O, Soejima T, Adachi S, Takada Y. Radiation pneumonitis following concurrent accelerated hyperfractionated radiotherapy and chemotherapy for limited-stage small-cell lung cancer: Dose-volume histogram analysis and comparison with conventional chemoradiation. Int J Radiat Oncol Biol Phys 2006;64:1100-5. [Crossref] [PubMed]
- Roach M 3rd, Gandara DR, Yuo HS, Swift PS, Kroll S, Shrieve DC, Wara WM, Margolis L, Phillips TL. Radiation pneumonitis following combined modality therapy for lung cancer: analysis of prognostic factors. J Clin Oncol 1995;13:2606-12. [PubMed]
- Bentzen SM, Skoczylas JZ, Bernier J. Quantitative clinical radiobiology of early and late lung reactions. Int J Radiat Biol 2000;76:453-62. [Crossref] [PubMed]
- Gurjar OP, Mishra SP, Bhandari V, Pathak P, Patel P, Shrivastav G. Radiation dose verification using real tissue phantom in modern radiotherapy techniques. J Med Phys 2014;39:44-9. [Crossref] [PubMed]
- Burman C, Kutcher GJ, Emami B, Goitein M. Fitting of normal tissue tolerance data to an analytic function. Int J Radiat Oncol Biol Phys 1991;21:123-35. [Crossref] [PubMed]
- Emami B, Lyman J, Brown A, Coia L, Goitein M, Munzenrider JE, Shank B, Solin LJ, Wesson M. Tolerance of normal tissue to therapeutic irradiation. Int J Radiat Oncol Biol Phys 1991;21:109-22. [Crossref] [PubMed]
- Hedin E, Bäck A. Influence of different dose calculation algorithms on the estimate of NTCP for lung complications. J Appl Clin Med Phys 2013;14:127-39. [PubMed]
- Chaikh A, Giraud JY, Perrin E, Bresciani JP, Balosso J. The choice of statistical methods for comparisons of dosimetric data in radiotherapy. Radiat Oncol 2014;9:205. [Crossref] [PubMed]
- Lax I, Panettieri V, Wennberg B, Amor Duch M, Näslund I, Baumann P, Gagliardi G. Dose distributions in SBRT of lung tumors: Comparison between two different treatment planning algorithms and Monte-Carlo simulation including breathing motions. Acta Oncol 2006;45:978-88. [Crossref] [PubMed]
- Aarup LR, Nahum AE, Zacharatou C, Juhler-Nøttrup T, Knöös T, Nyström H, Specht L, Wieslander E, Korreman SS. The effect of different lung densities on the accuracy of various radiotherapy dose calculation methods: implications for tumour coverage. Radiother Oncol 2009;91:405-14. [Crossref] [PubMed]
- Fdhila M, Gabelle-Flandin I, Balosso J, Chaikh A. Quantitative evaluation of the impact of heterogeneity correction on left breast cancer radiotherapy performed with respiratory gating. Int J Cancer Ther Oncol 2016;4:417. [Crossref]
- Chaikh A, Balosso J. The use of radiobiological TCP and NTCP models to validate the dose calculation algorithm and readjust the prescribed dose. Radiother Oncol 2016;118:15-9. [Crossref]

